 2
2peptides
spectra
0.000 | 0.000
0.000 | 0.095
0.000 | 0.339
0.089 | 0.668
0.000 | 0.000
0.000 | 0.502
0.000 | 0.281
0.000 | 0.140
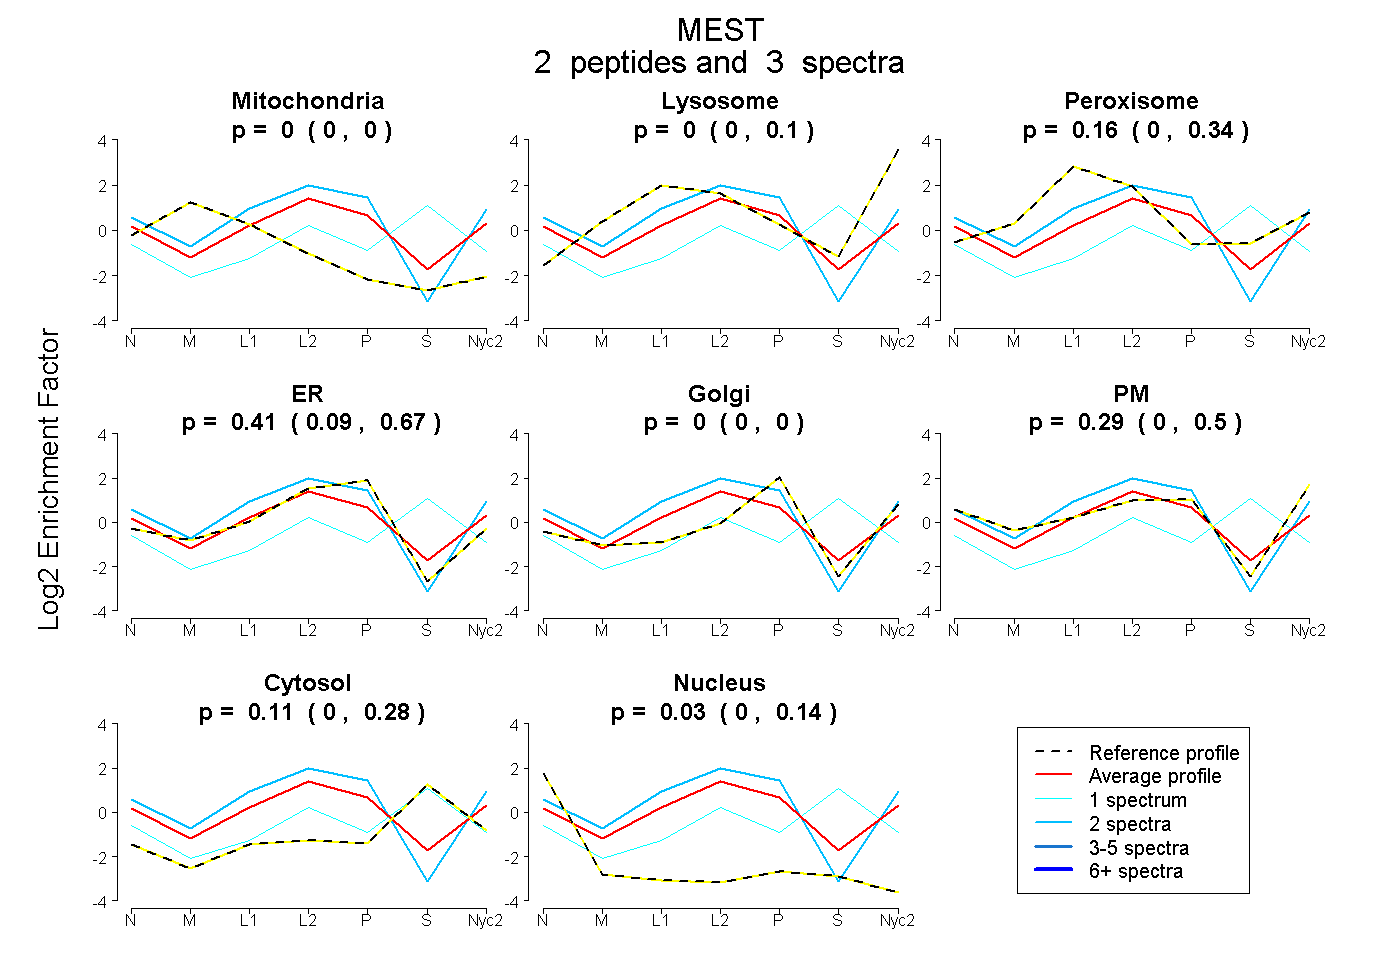
| Plot | Mito | Lyso | Perox | ER | Golgi | PM | Cytosol | Nucleus | |||||
| Expt A |
2 peptides |
3 spectra |
|
0.000 0.000 | 0.000 |
0.000 0.000 | 0.095 |
0.157 0.000 | 0.339 |
0.412 0.089 | 0.668 |
0.000 0.000 | 0.000 |
0.287 0.000 | 0.502 |
0.111 0.000 | 0.281 |
0.033 0.000 | 0.140 |