 2
2peptides
spectra
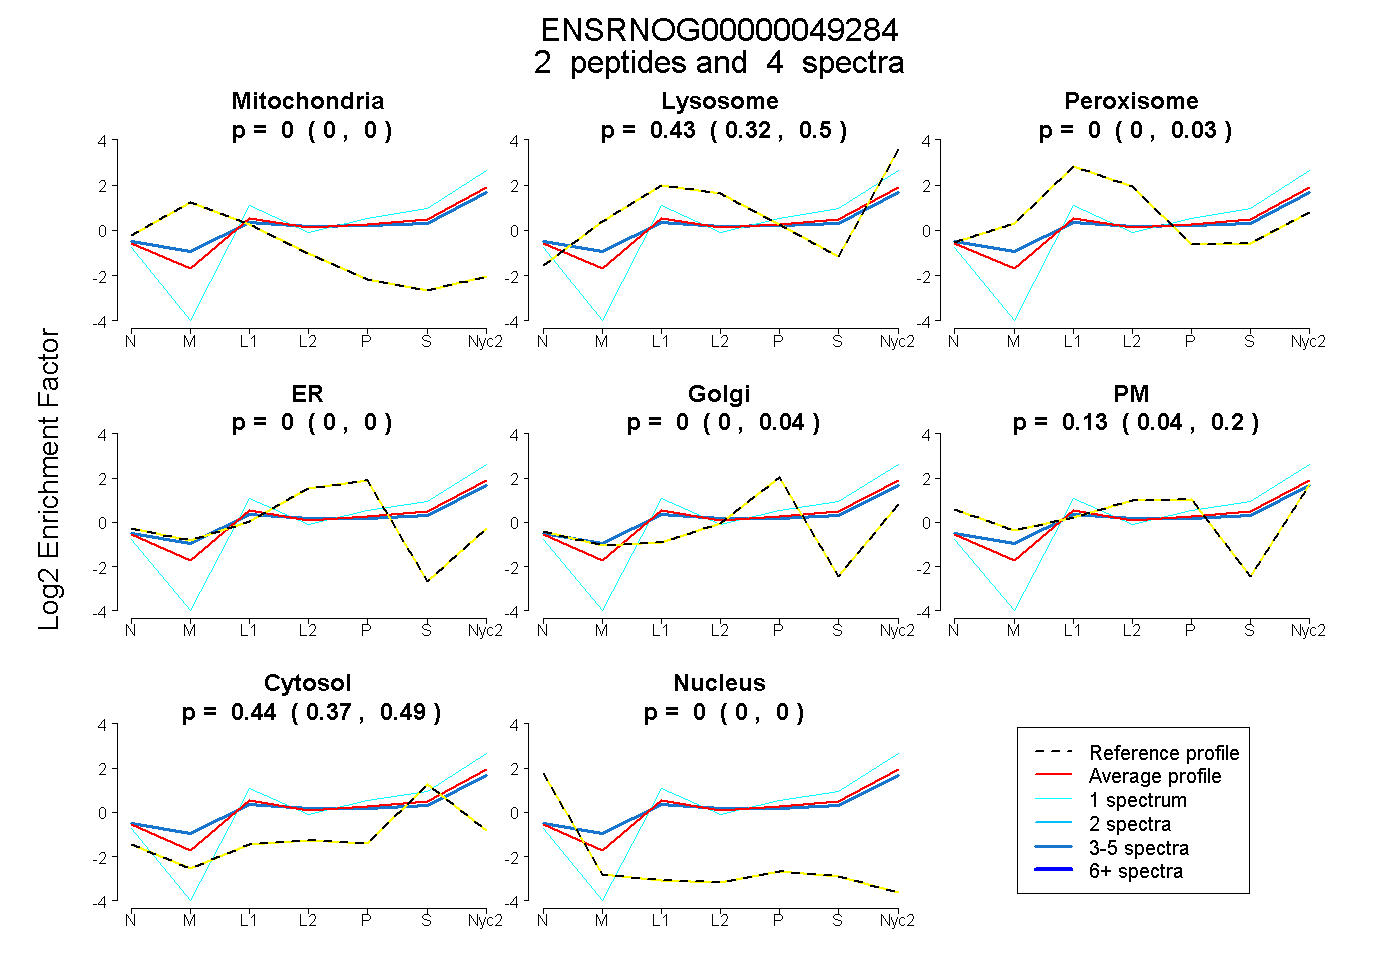
0.000 | 0.000
0.318 | 0.505
0.000 | 0.033
0.000 | 0.000
0.000 | 0.043
0.040 | 0.198
0.366 | 0.491
0.000 | 0.000
1peptide
spectra
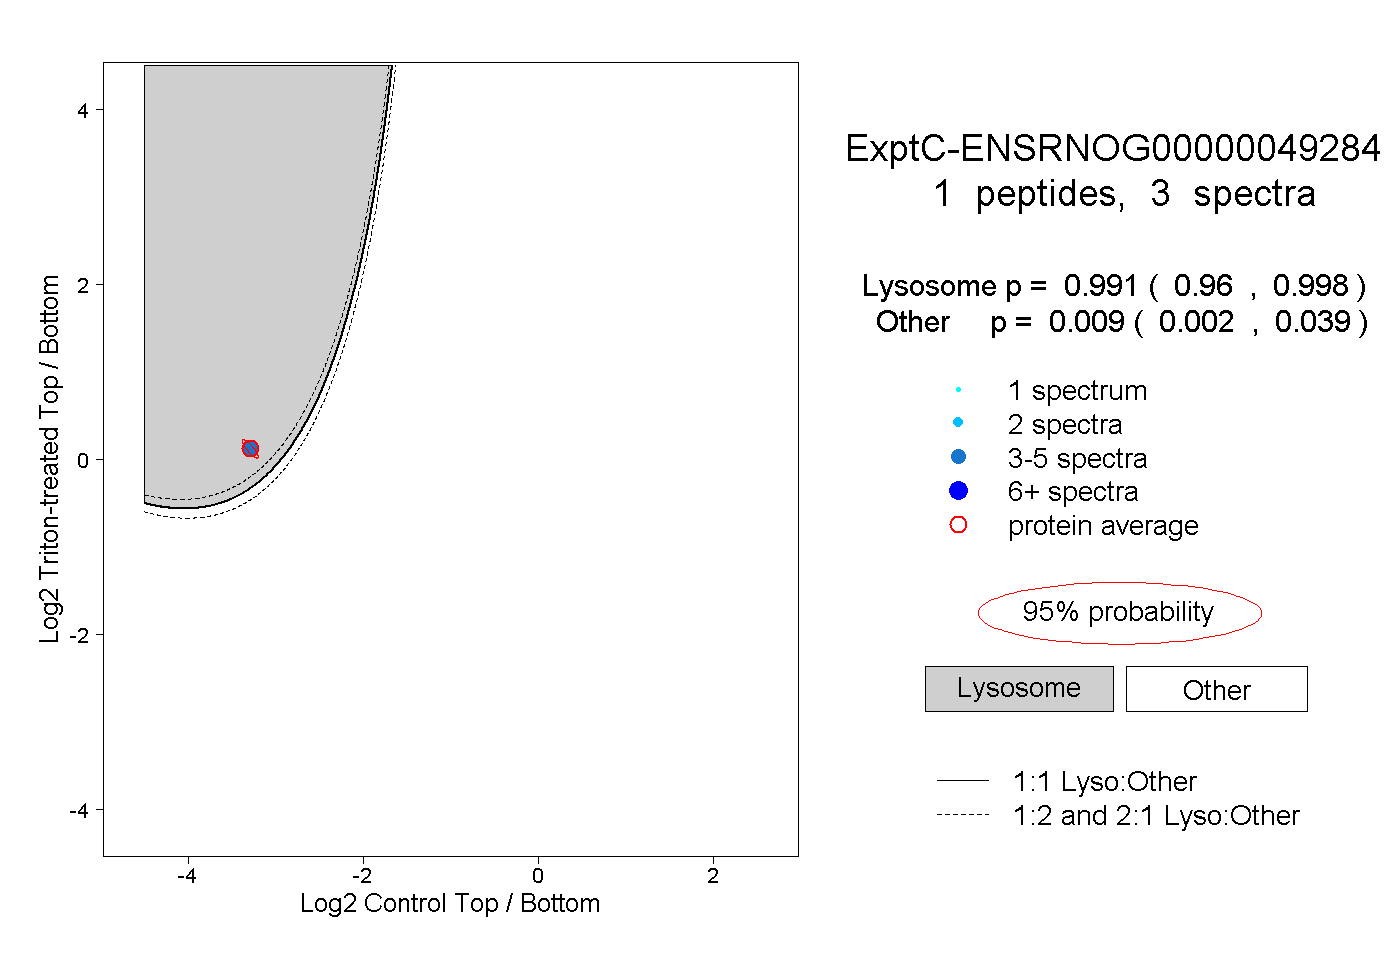
0.960 | 0.998
0.002 | 0.039
1peptide
spectrum
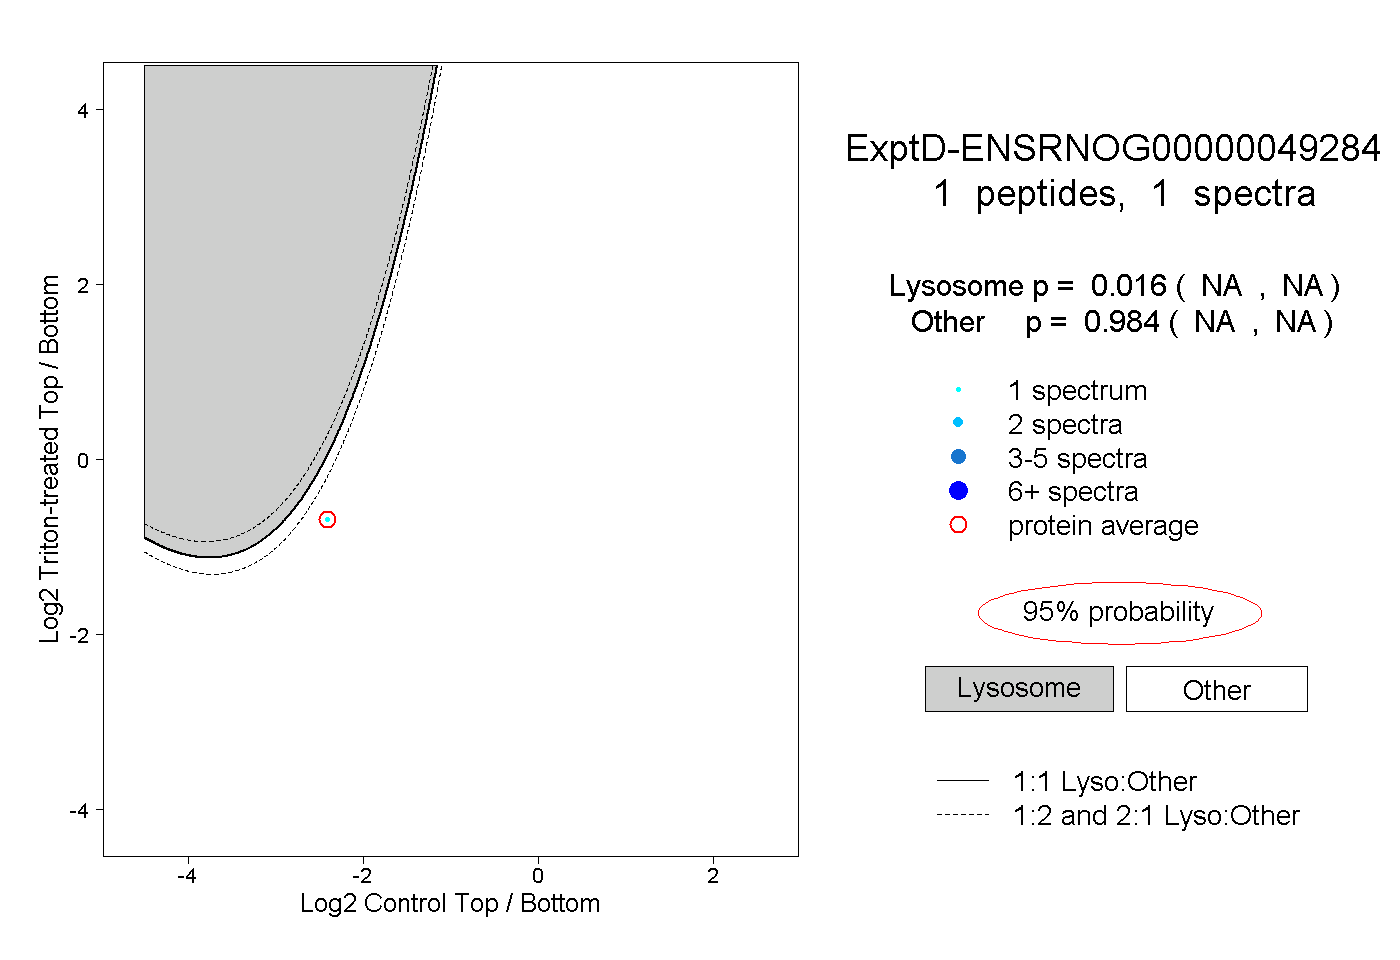
NA | NA
NA | NA