 5
5peptides
spectra
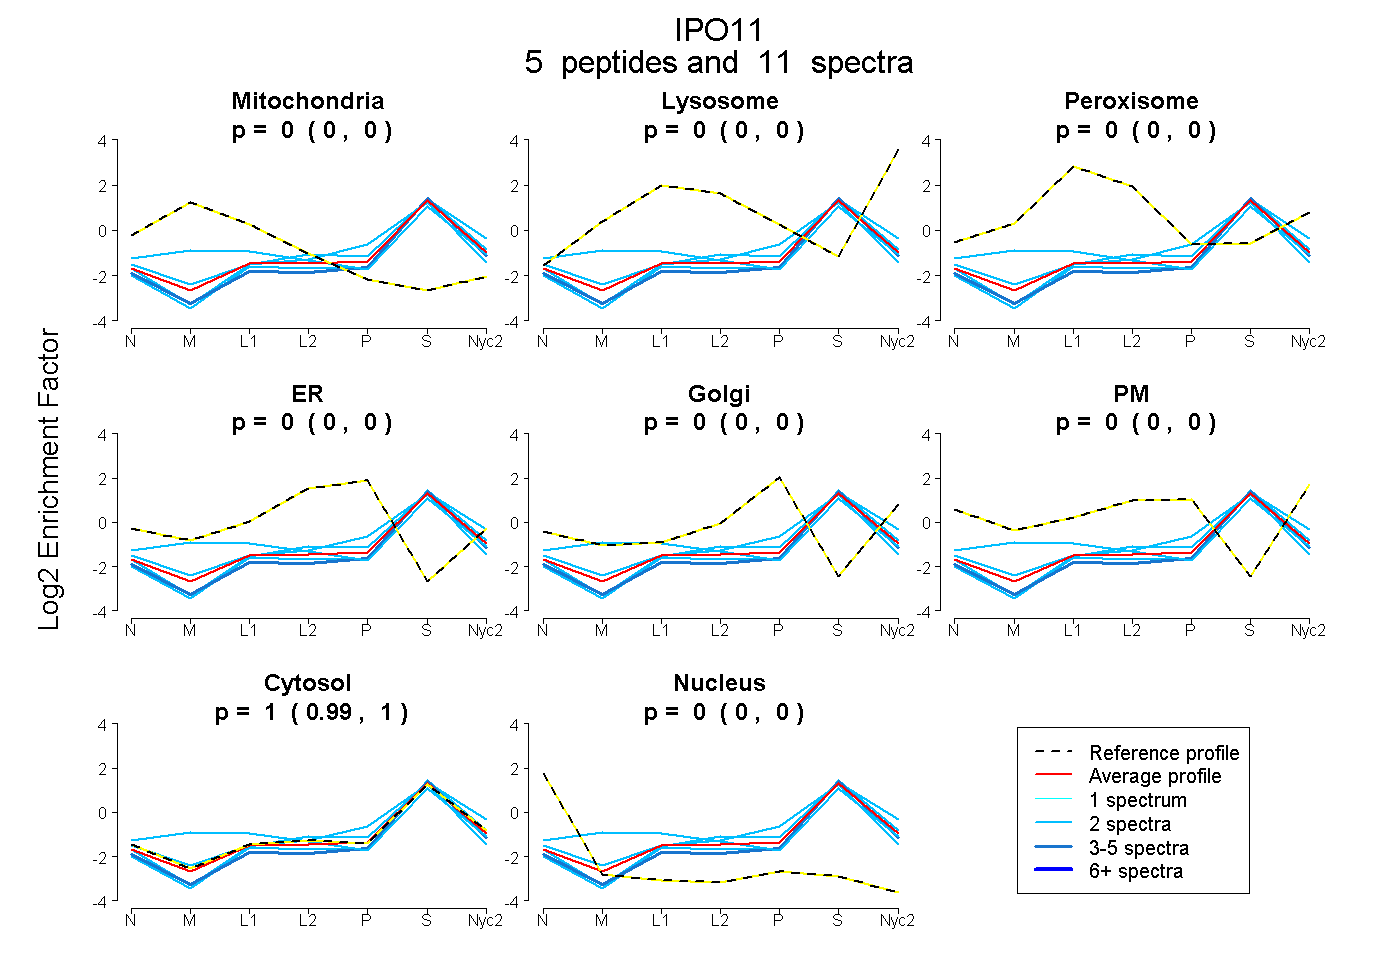
0.000 | 0.001
0.000 | 0.000
0.000 | 0.000
0.000 | 0.000
0.000 | 0.000
0.000 | 0.000
0.990 | 1.000
0.000 | 0.005
| Plot | Mito | Lyso | Perox | ER | Golgi | PM | Cytosol | Nucleus | |||||
| Expt A |
5 peptides |
11 spectra |
|
0.000 0.000 | 0.001 |
0.000 0.000 | 0.000 |
0.000 0.000 | 0.000 |
0.000 0.000 | 0.000 |
0.000 0.000 | 0.000 |
0.000 0.000 | 0.000 |
1.000 0.990 | 1.000 |
0.000 0.000 | 0.005 |
| 2 spectra, VNPVLGPQMFQR | 0.221 | 0.000 | 0.024 | 0.000 | 0.000 | 0.000 | 0.755 | 0.000 | ||
| 2 spectra, ILPYVFR | 0.000 | 0.008 | 0.000 | 0.000 | 0.000 | 0.000 | 0.992 | 0.000 | ||
| 2 spectra, ALLTFYHVTK | 0.000 | 0.000 | 0.000 | 0.000 | 0.000 | 0.000 | 1.000 | 0.000 | ||
| 3 spectra, LTVDDFEFR | 0.000 | 0.000 | 0.000 | 0.000 | 0.000 | 0.000 | 0.979 | 0.021 | ||
| 2 spectra, SIGTDNVCR | 0.000 | 0.000 | 0.000 | 0.055 | 0.000 | 0.000 | 0.939 | 0.006 |
| Plot | Lyso | Other | |||||||||||
| Expt C |
4 peptides |
7 spectra |
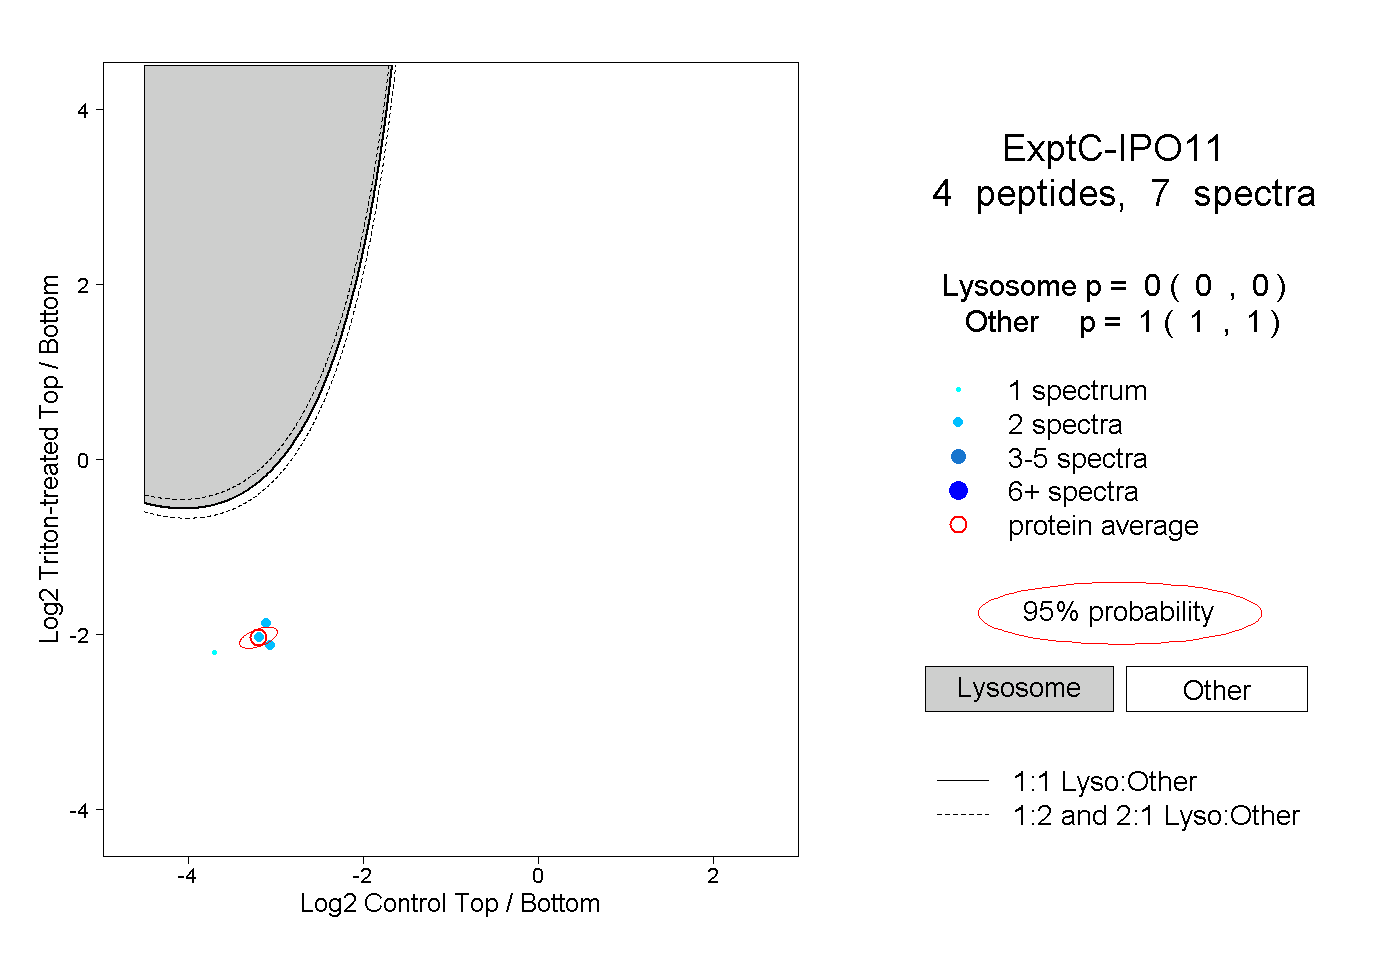 |
0.000 0.000 | 0.000 |
1.000 1.000 | 1.000 |