 2
2peptides
spectra
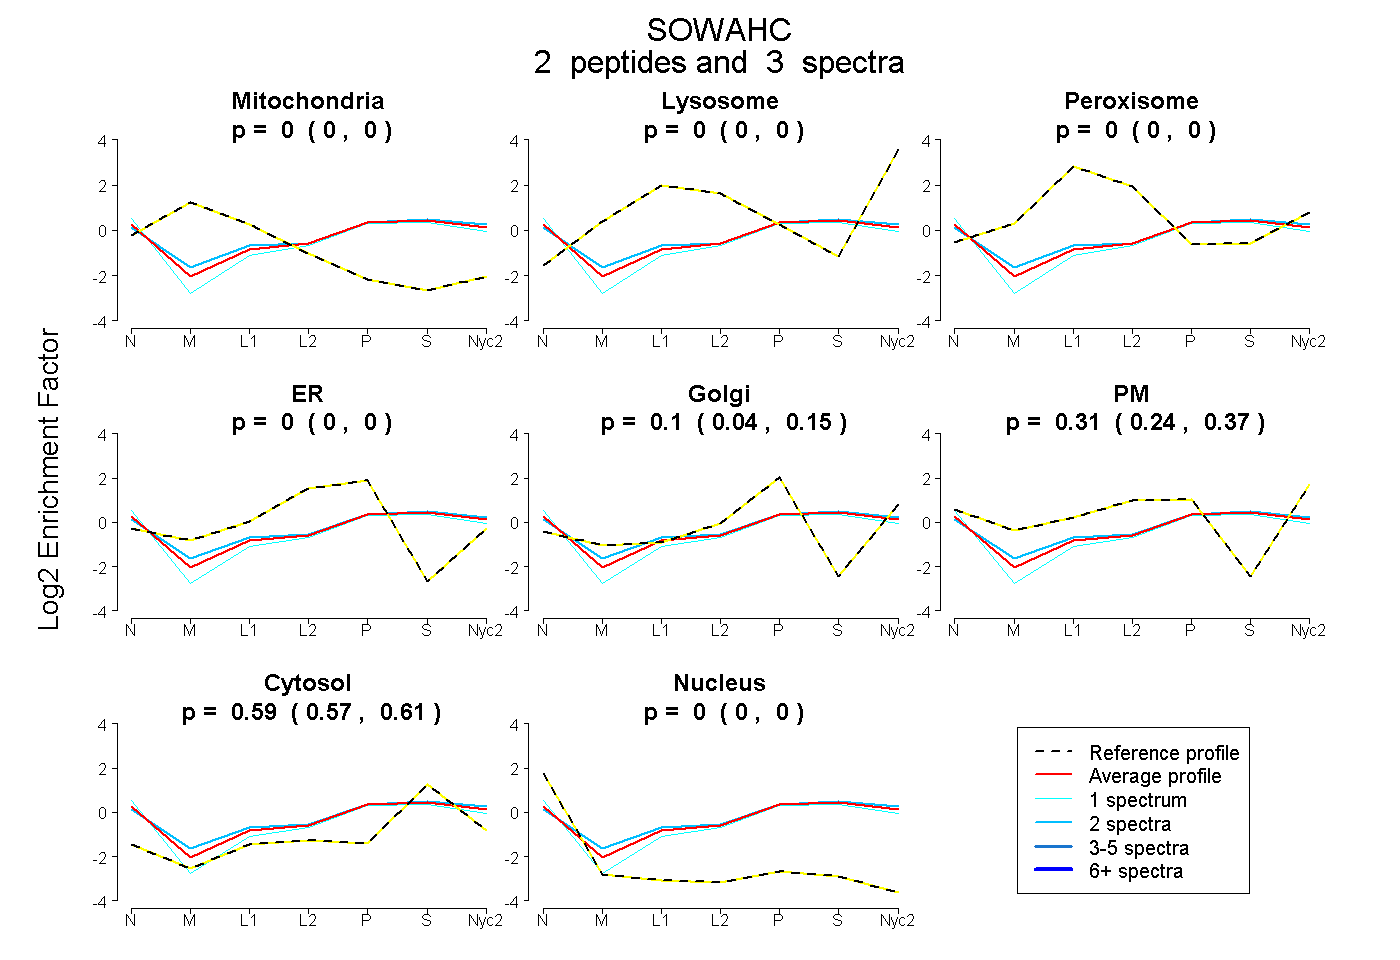
0.000 | 0.000
0.000 | 0.000
0.000 | 0.000
0.000 | 0.000
0.037 | 0.145
0.243 | 0.374
0.571 | 0.606
0.000 | 0.003
| Plot | Mito | Lyso | Perox | ER | Golgi | PM | Cytosol | Nucleus | |||||
| Expt A |
2 peptides |
3 spectra |
|
0.000 0.000 | 0.000 |
0.000 0.000 | 0.000 |
0.000 0.000 | 0.000 |
0.000 0.000 | 0.000 |
0.096 0.037 | 0.145 |
0.314 0.243 | 0.374 |
0.590 0.571 | 0.606 |
0.000 0.000 | 0.003 |
| 1 spectrum, NLVGALDEDDGDSAAGR | 0.000 | 0.000 | 0.000 | 0.000 | 0.161 | 0.209 | 0.580 | 0.050 | ||
| 2 spectra, ELVNAVATVR | 0.000 | 0.000 | 0.000 | 0.000 | 0.047 | 0.377 | 0.576 | 0.000 |
| Plot | Lyso | Other | |||||||||||
| Expt C |
1 peptide |
2 spectra |
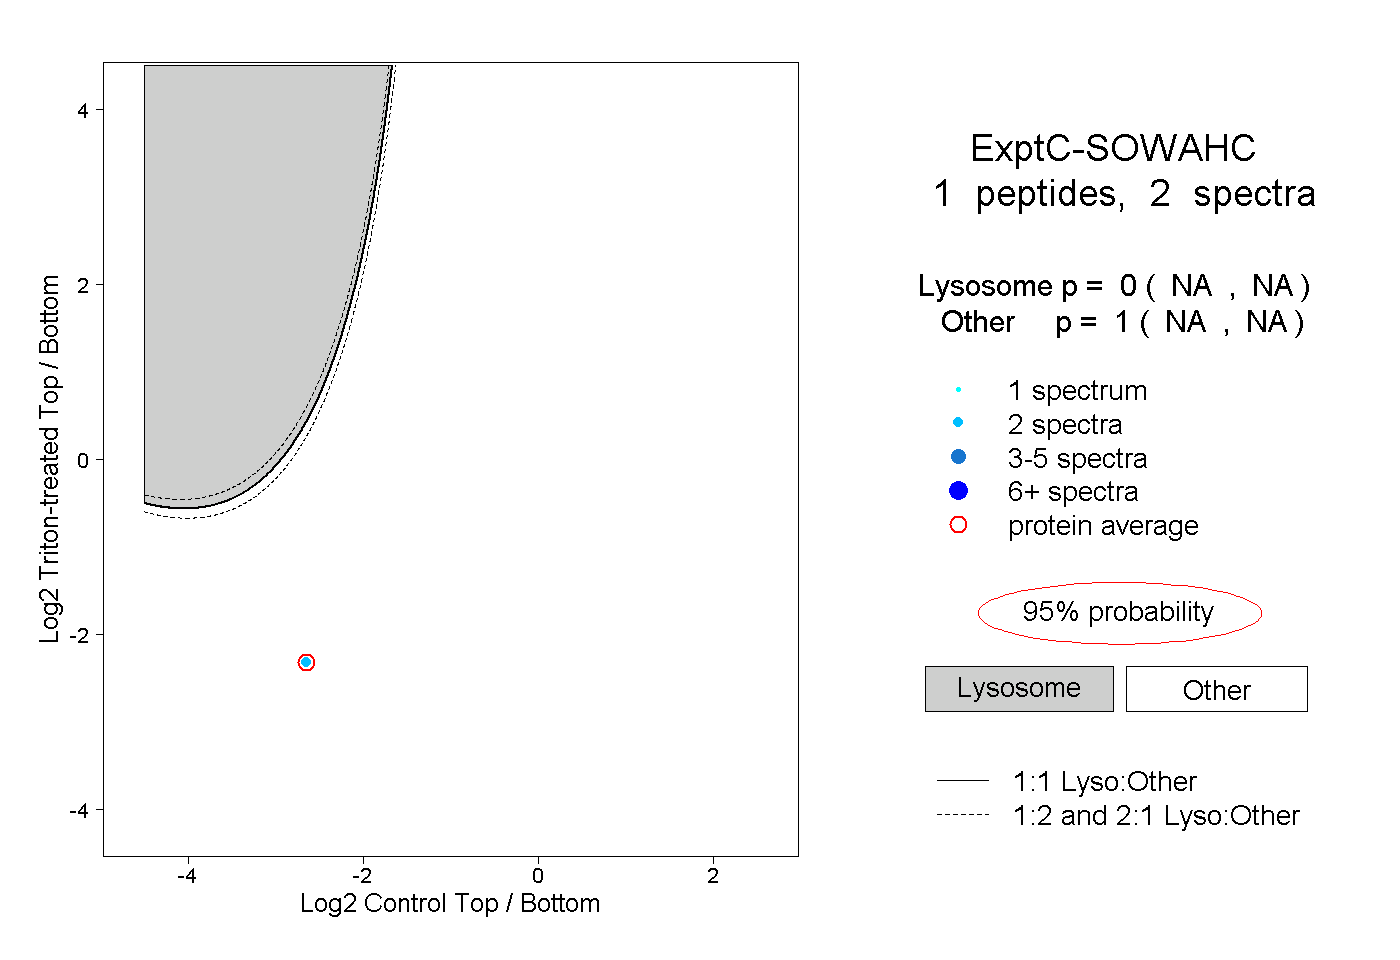 |
0.000 NA | NA |
1.000 NA | NA |