 1
1peptide
spectrum
NA | NA
NA | NA
NA | NA
NA | NA
NA | NA
NA | NA
NA | NA
NA | NA
2peptides
spectra
0.347 | 0.455
0.000 | 0.081
0.000 | 0.000
0.000 | 0.000
0.000 | 0.000
0.528 | 0.575
0.000 | 0.000
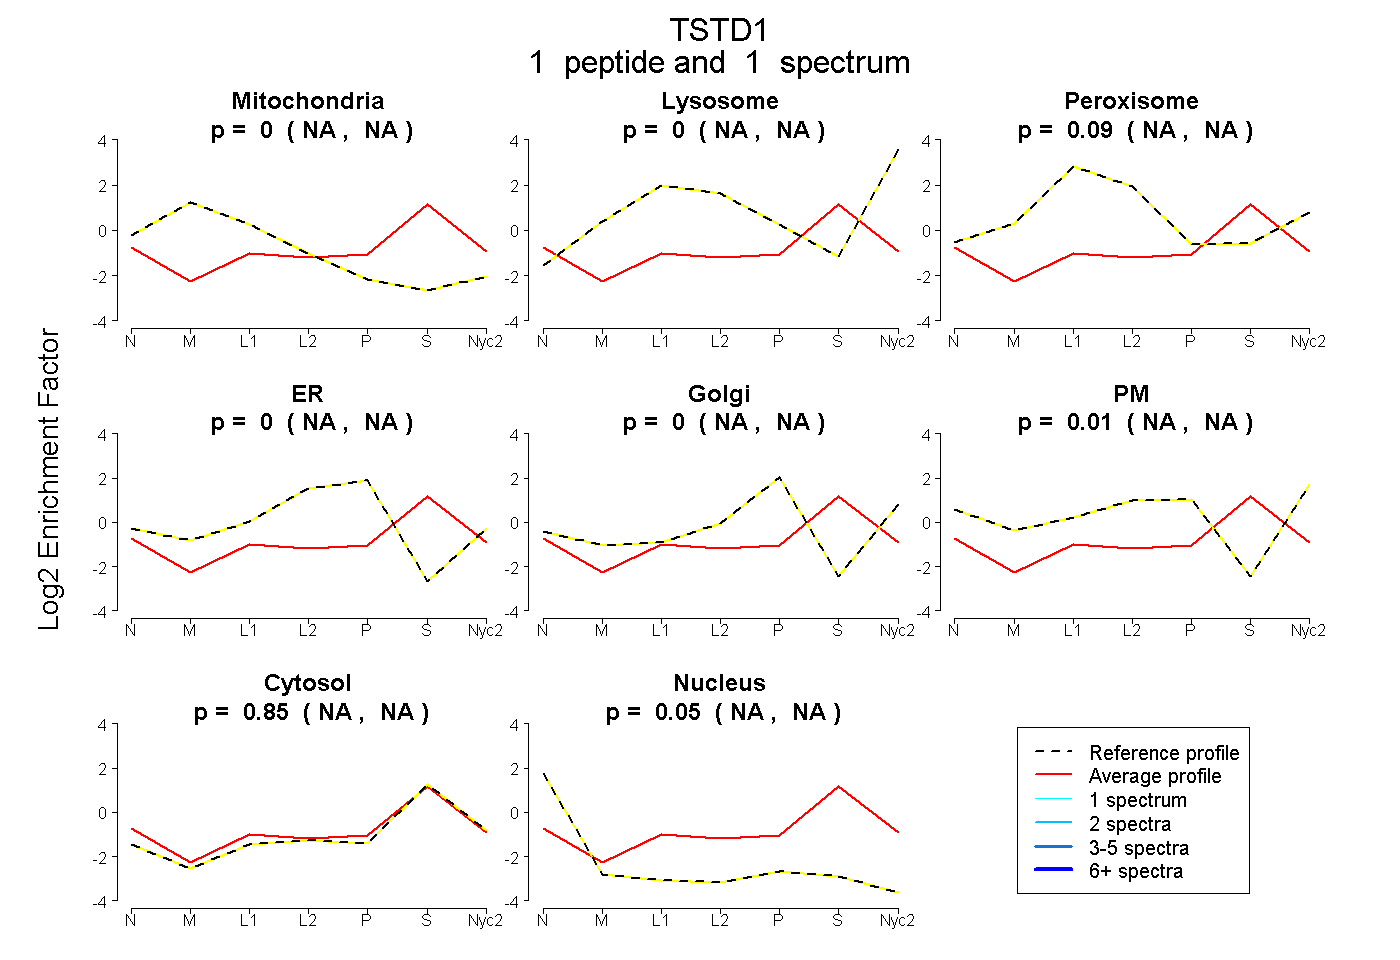
| Plot | Mito | Lyso | Perox | ER | Golgi | PM | Cytosol | Nucleus | |||||
| Expt A |
1 peptide |
1 spectrum |
|
0.000 NA | NA |
0.000 NA | NA |
0.087 NA | NA |
0.000 NA | NA |
0.000 NA | NA |
0.014 NA | NA |
0.848 NA | NA |
0.051 NA | NA |
||
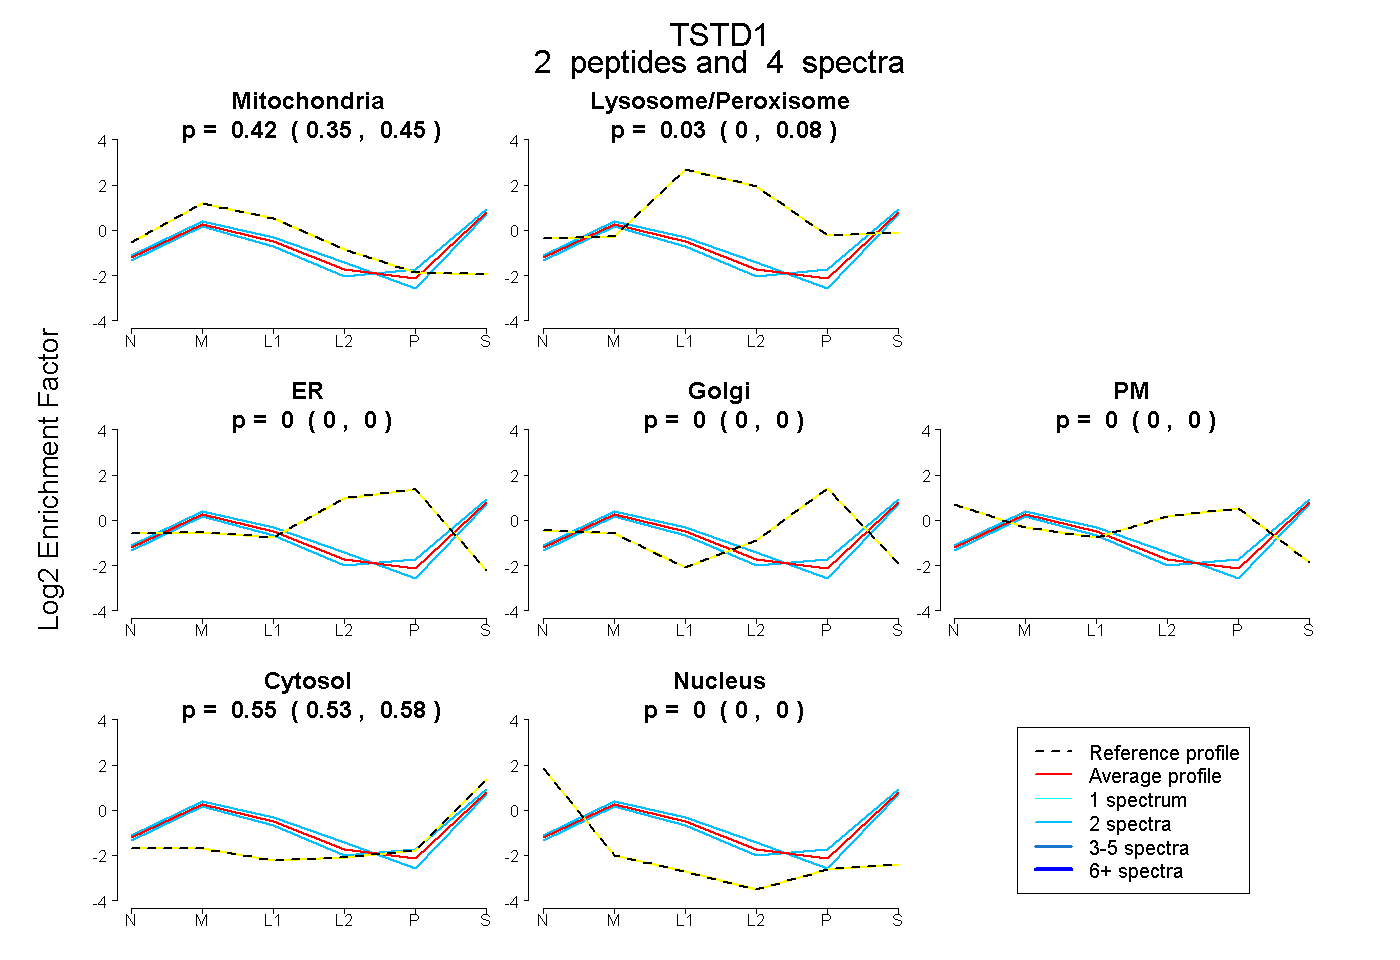
| Plot | Mito | Lyso or Perox | ER | Golgi | PM | Cytosol | Nucleus | ||||||
| Expt B |
2 peptides |
4 spectra |
|
0.417 0.347 | 0.455 |
0.029 0.000 | 0.081 |
0.000 0.000 | 0.000 |
0.000 0.000 | 0.000 |
0.000 0.000 | 0.000 |
0.554 0.528 | 0.575 |
0.000 0.000 | 0.000 |
| 2 spectra, QLLASGR | 0.370 | 0.018 | 0.000 | 0.000 | 0.000 | 0.612 | 0.000 | |||
| 2 spectra, GLQATQLAQGLGYTGAR | 0.464 | 0.040 | 0.000 | 0.000 | 0.000 | 0.497 | 0.000 |
| Plot | Lyso | Other | |||||||||||
| Expt C |
2 peptides |
3 spectra |
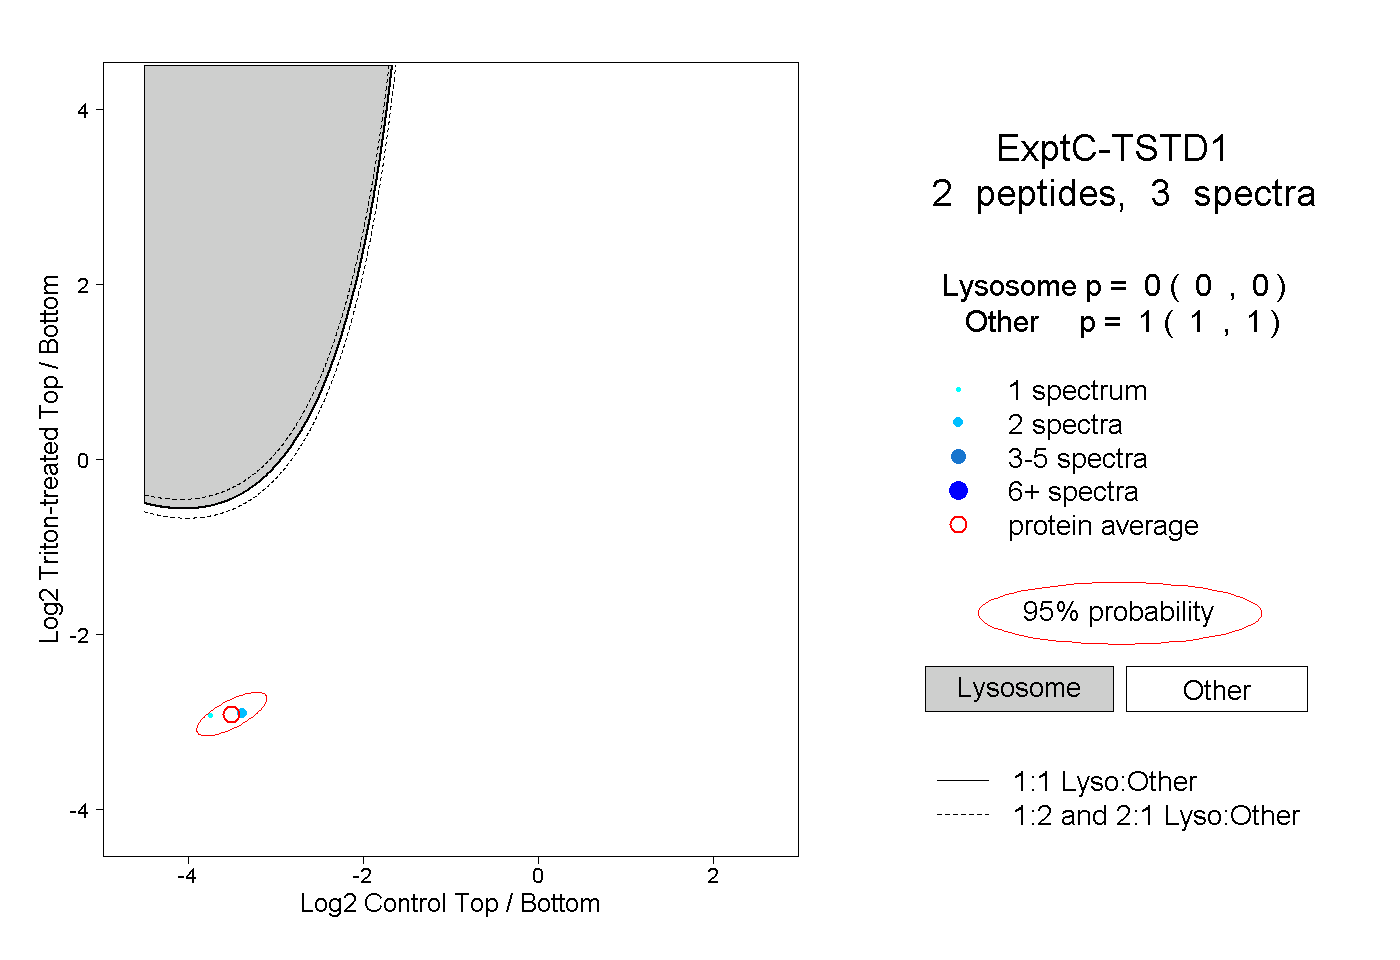 |
0.000 0.000 | 0.000 |
1.000 1.000 | 1.000 |
||||||||
| Plot | Lyso | Other | |||||||||||
| Expt D |
1 peptide |
1 spectrum |
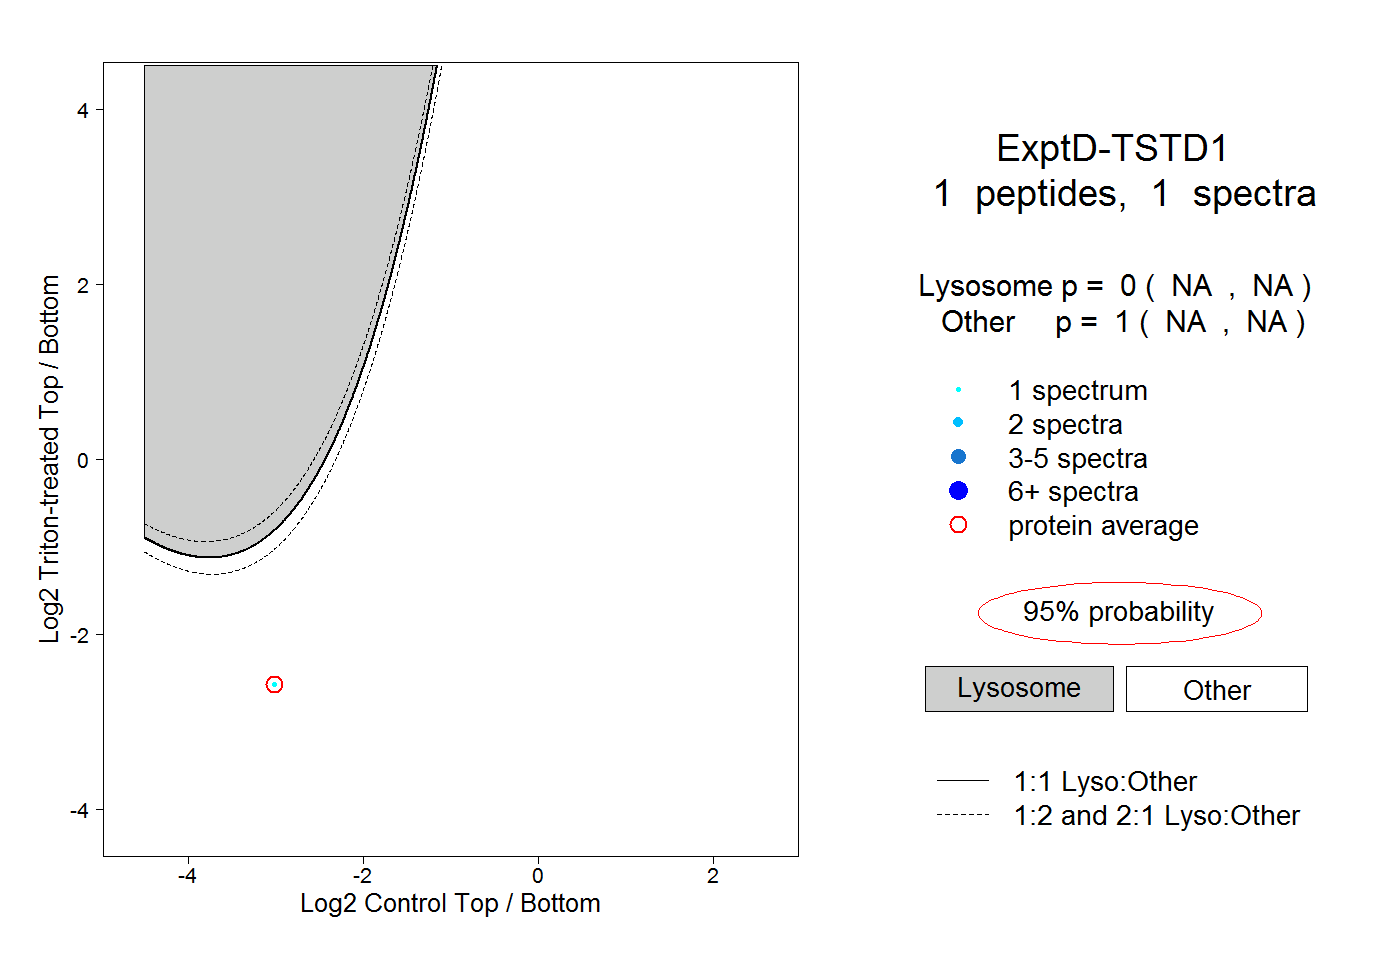 |
0.000 NA | NA |
1.000 NA | NA |