 5
5peptides
spectra
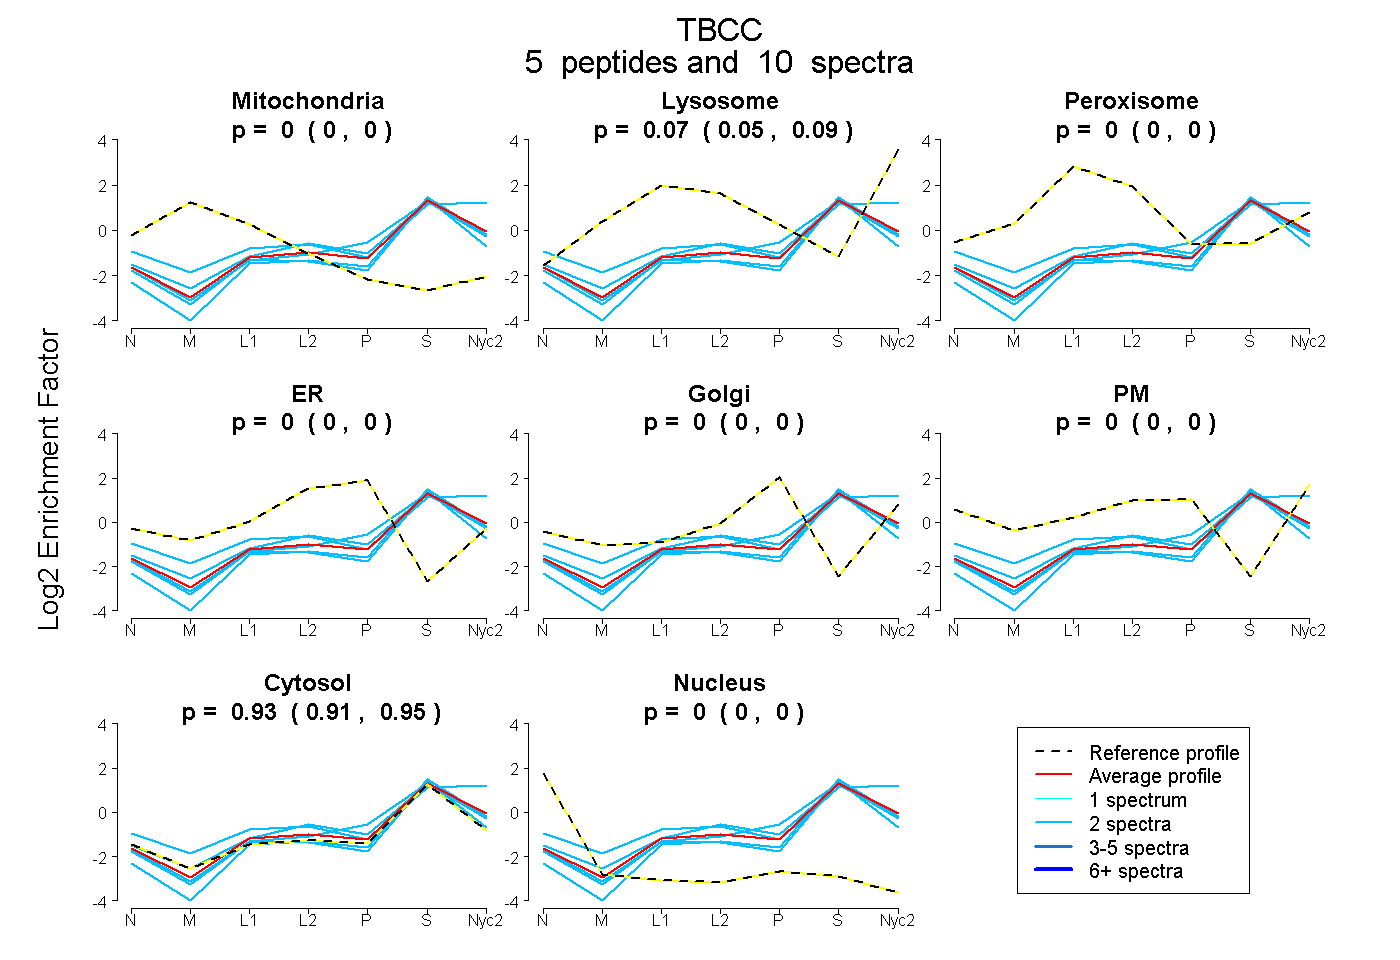
0.000 | 0.000
0.051 | 0.089
0.000 | 0.000
0.000 | 0.000
0.000 | 0.000
0.000 | 0.000
0.907 | 0.946
0.000 | 0.000
| Plot | Mito | Lyso | Perox | ER | Golgi | PM | Cytosol | Nucleus | |||||
| Expt A |
5 peptides |
10 spectra |
|
0.000 0.000 | 0.000 |
0.071 0.051 | 0.089 |
0.000 0.000 | 0.000 |
0.000 0.000 | 0.000 |
0.000 0.000 | 0.000 |
0.000 0.000 | 0.000 |
0.929 0.907 | 0.946 |
0.000 0.000 | 0.000 |
| 2 spectra, IFLQVTSR | 0.000 | 0.277 | 0.000 | 0.000 | 0.000 | 0.000 | 0.723 | 0.000 | ||
| 2 spectra, GNPNTLR | 0.000 | 0.014 | 0.000 | 0.000 | 0.073 | 0.000 | 0.913 | 0.000 | ||
| 2 spectra, SGFFAAAFAR | 0.000 | 0.000 | 0.000 | 0.000 | 0.000 | 0.000 | 1.000 | 0.000 | ||
| 2 spectra, DLSLVPER | 0.000 | 0.000 | 0.000 | 0.000 | 0.000 | 0.000 | 1.000 | 0.000 | ||
| 2 spectra, AEELHQR | 0.000 | 0.109 | 0.000 | 0.000 | 0.000 | 0.000 | 0.891 | 0.000 |