 1
1peptide
spectra
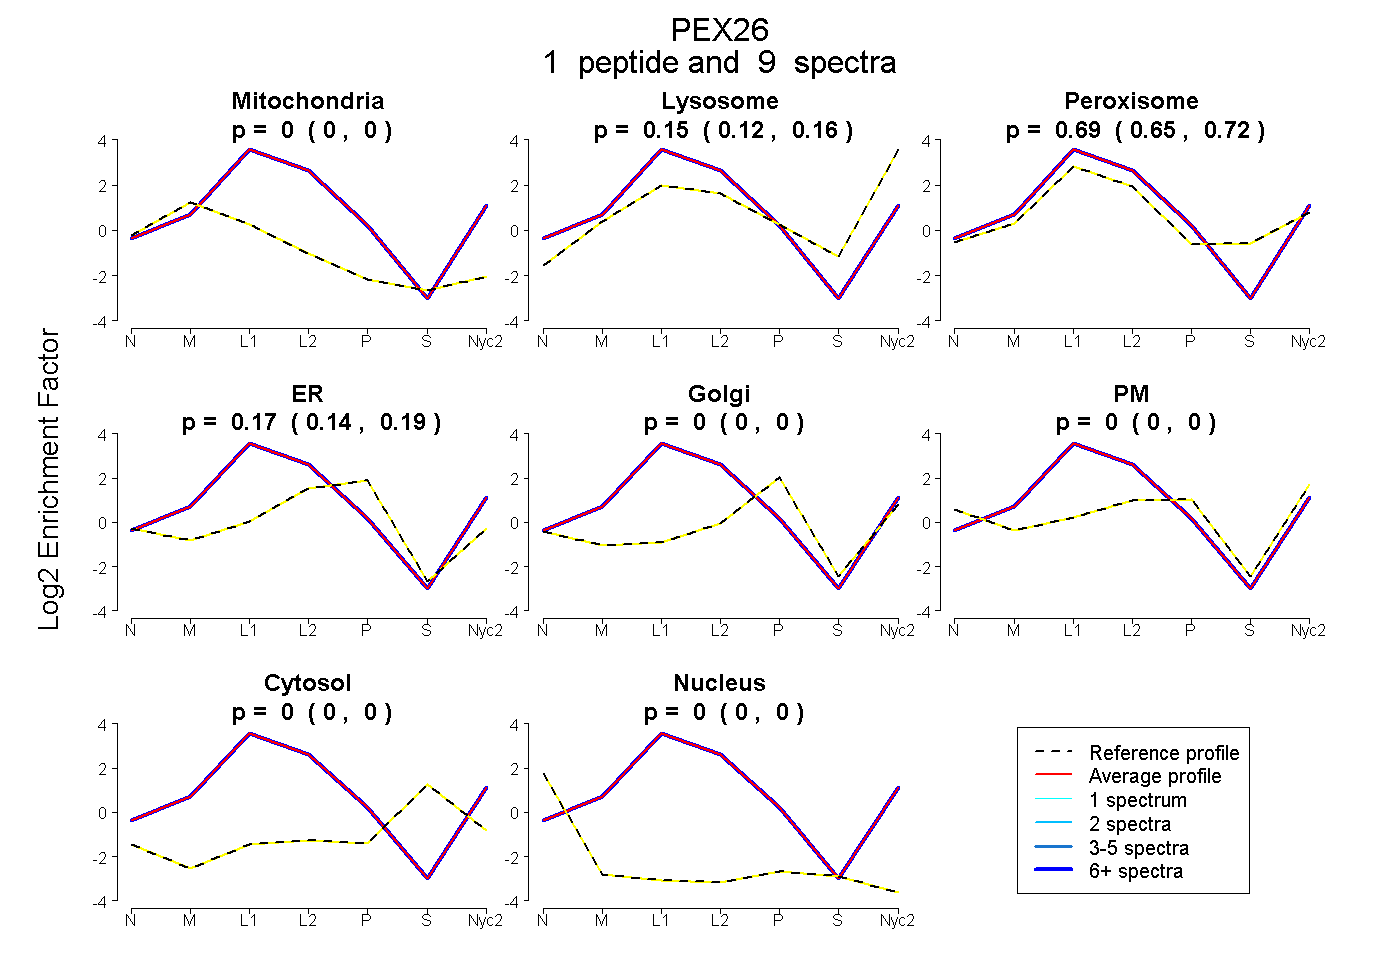
0.000 | 0.000
0.121 | 0.164
0.648 | 0.719
0.143 | 0.190
0.000 | 0.000
0.000 | 0.000
0.000 | 0.000
0.000 | 0.000
1peptide
spectra
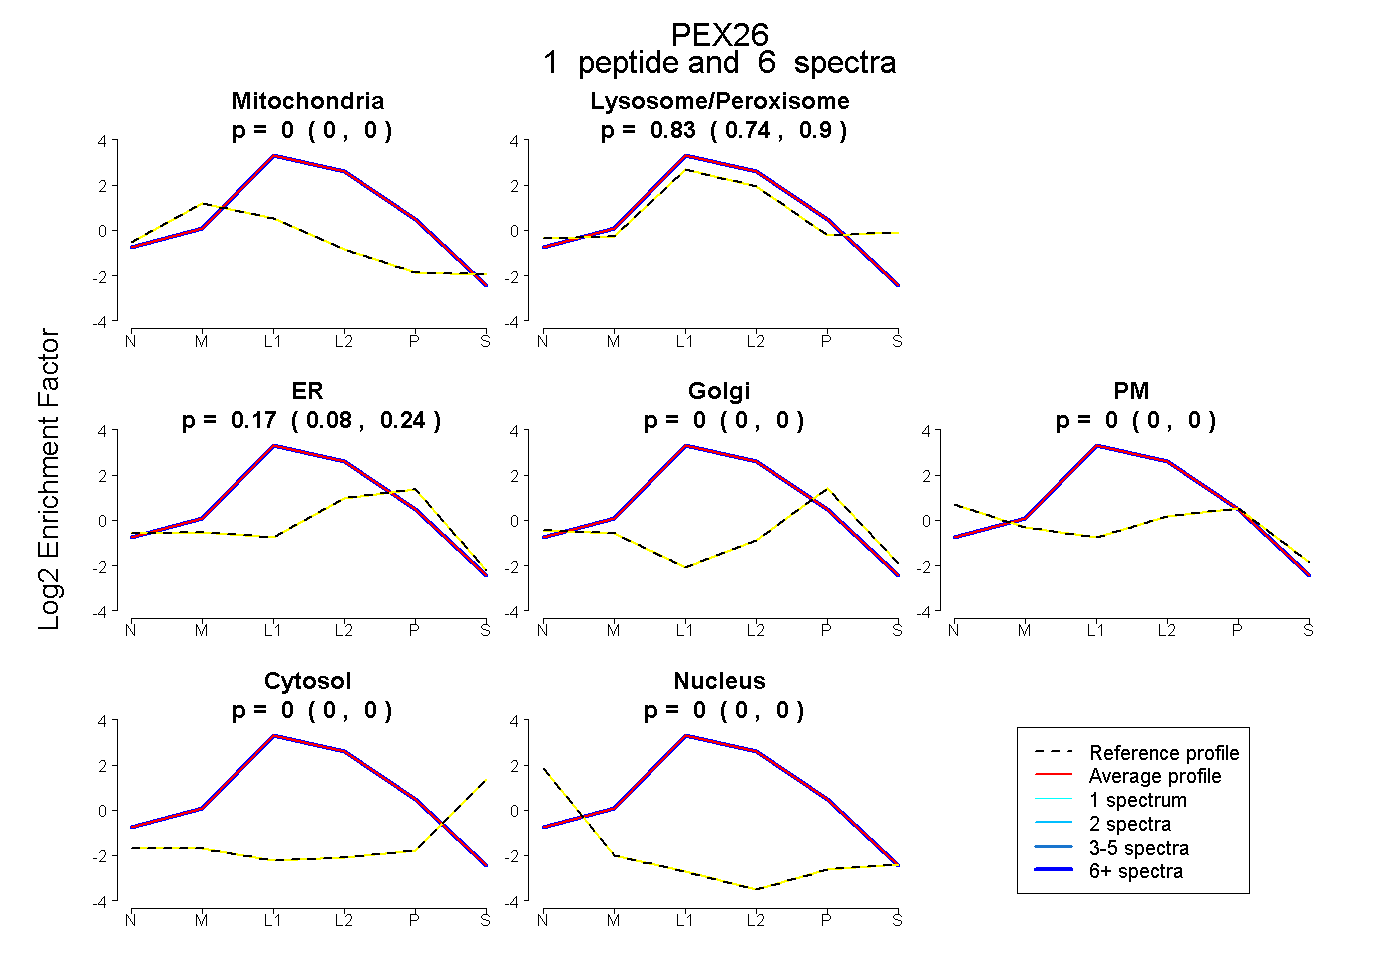
0.000 | 0.000
0.740 | 0.904
0.083 | 0.242
0.000 | 0.000
0.000 | 0.000
0.000 | 0.000
0.000 | 0.000
6peptides
spectra
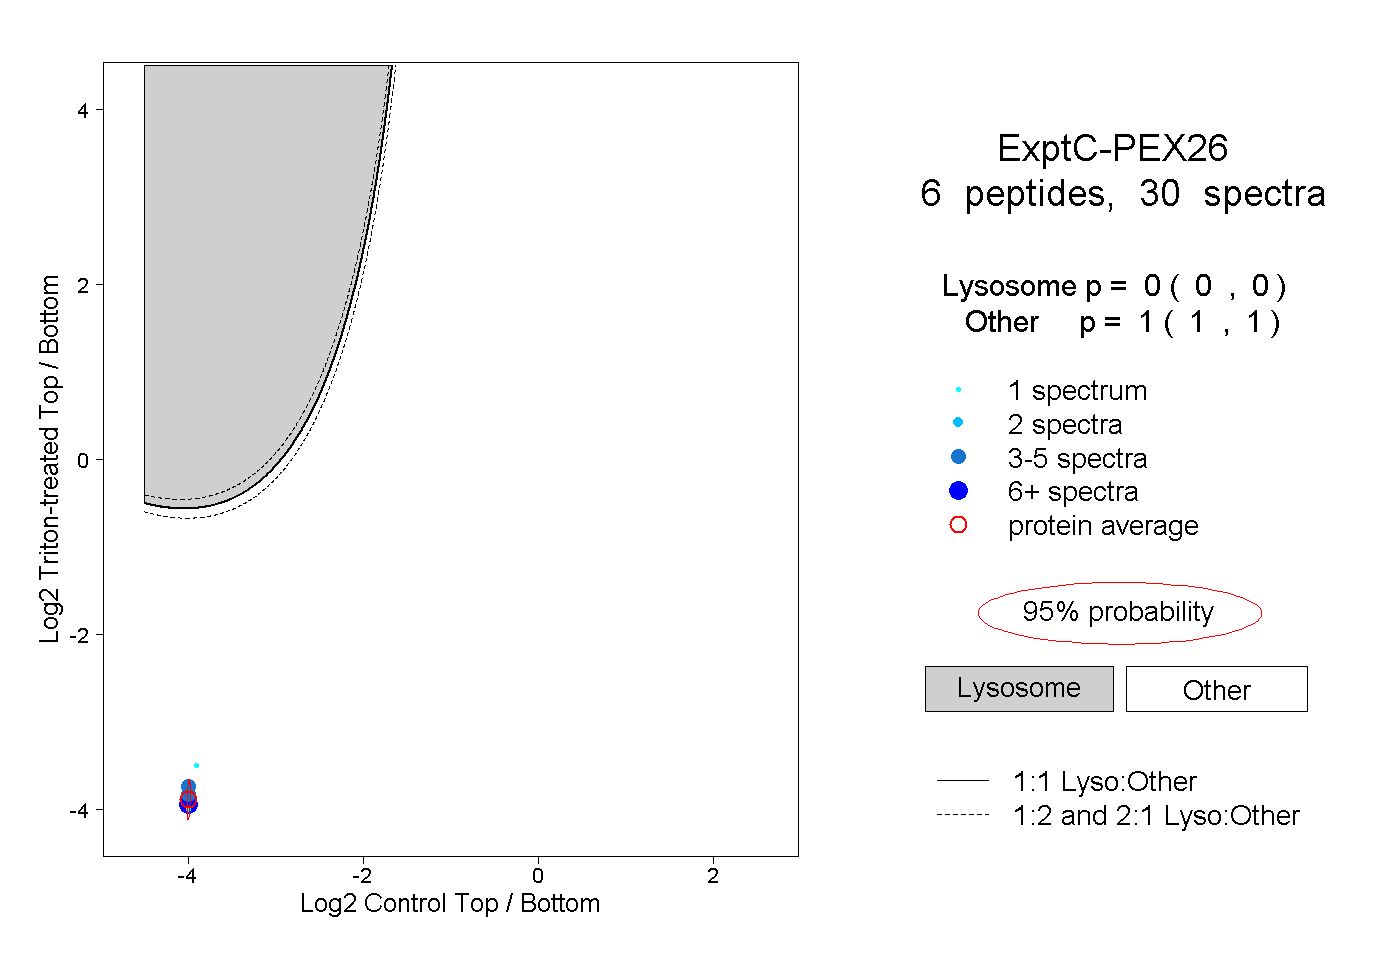
0.000 | 0.000
1.000 | 1.000
2peptides
spectra
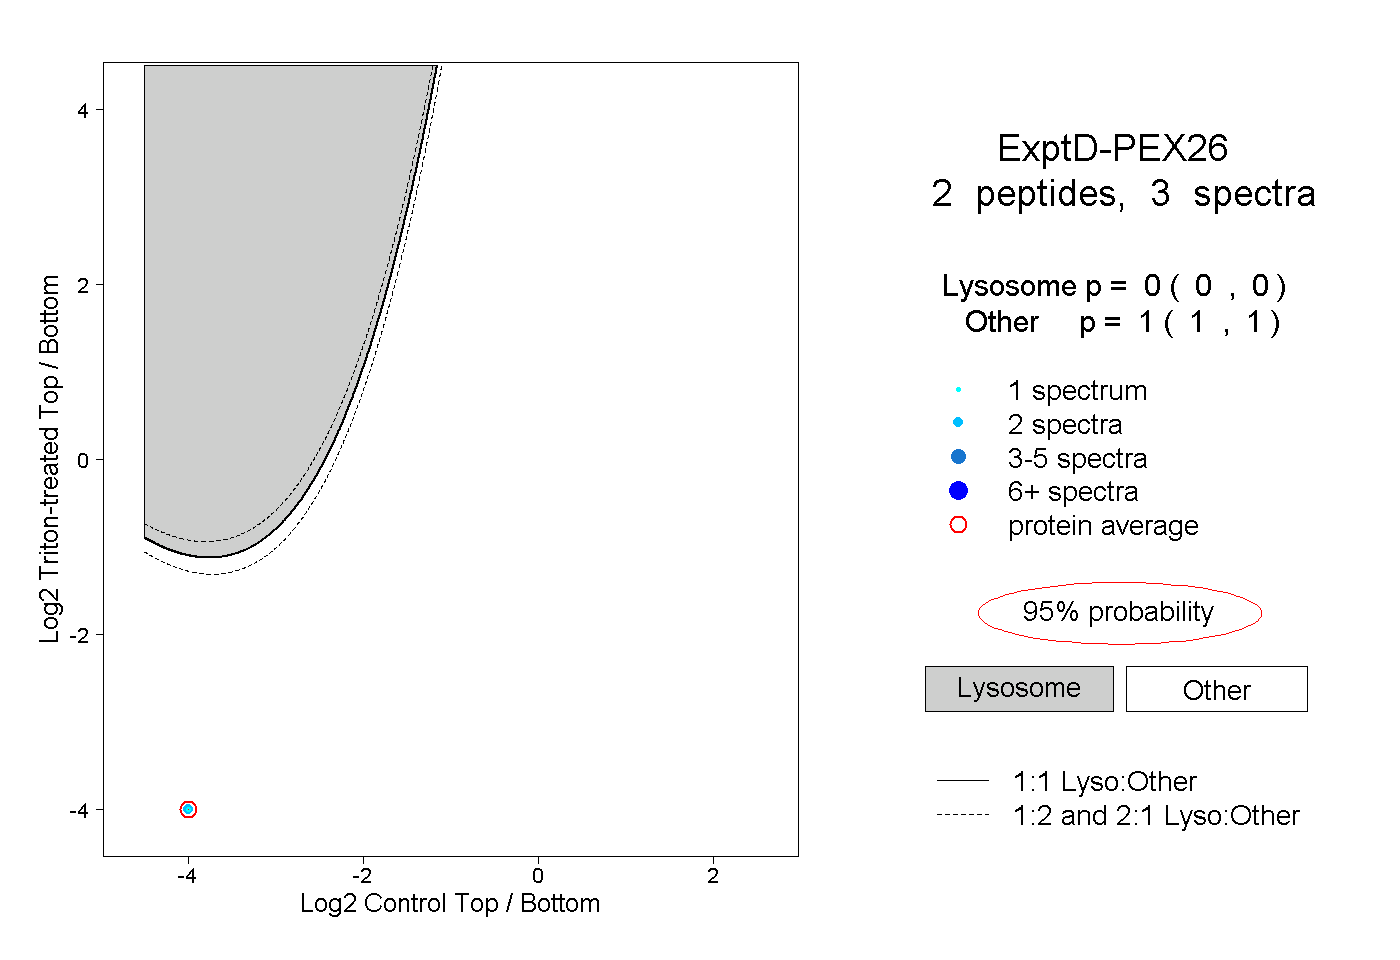
0.000 | 0.000
1.000 | 1.000