 2
2peptides
spectra

0.000 | 0.000
0.000 | 0.000
0.000 | 0.062
0.011 | 0.425
0.000 | 0.254
0.000 | 0.005
0.420 | 0.614
0.000 | 0.214
1peptide
spectra
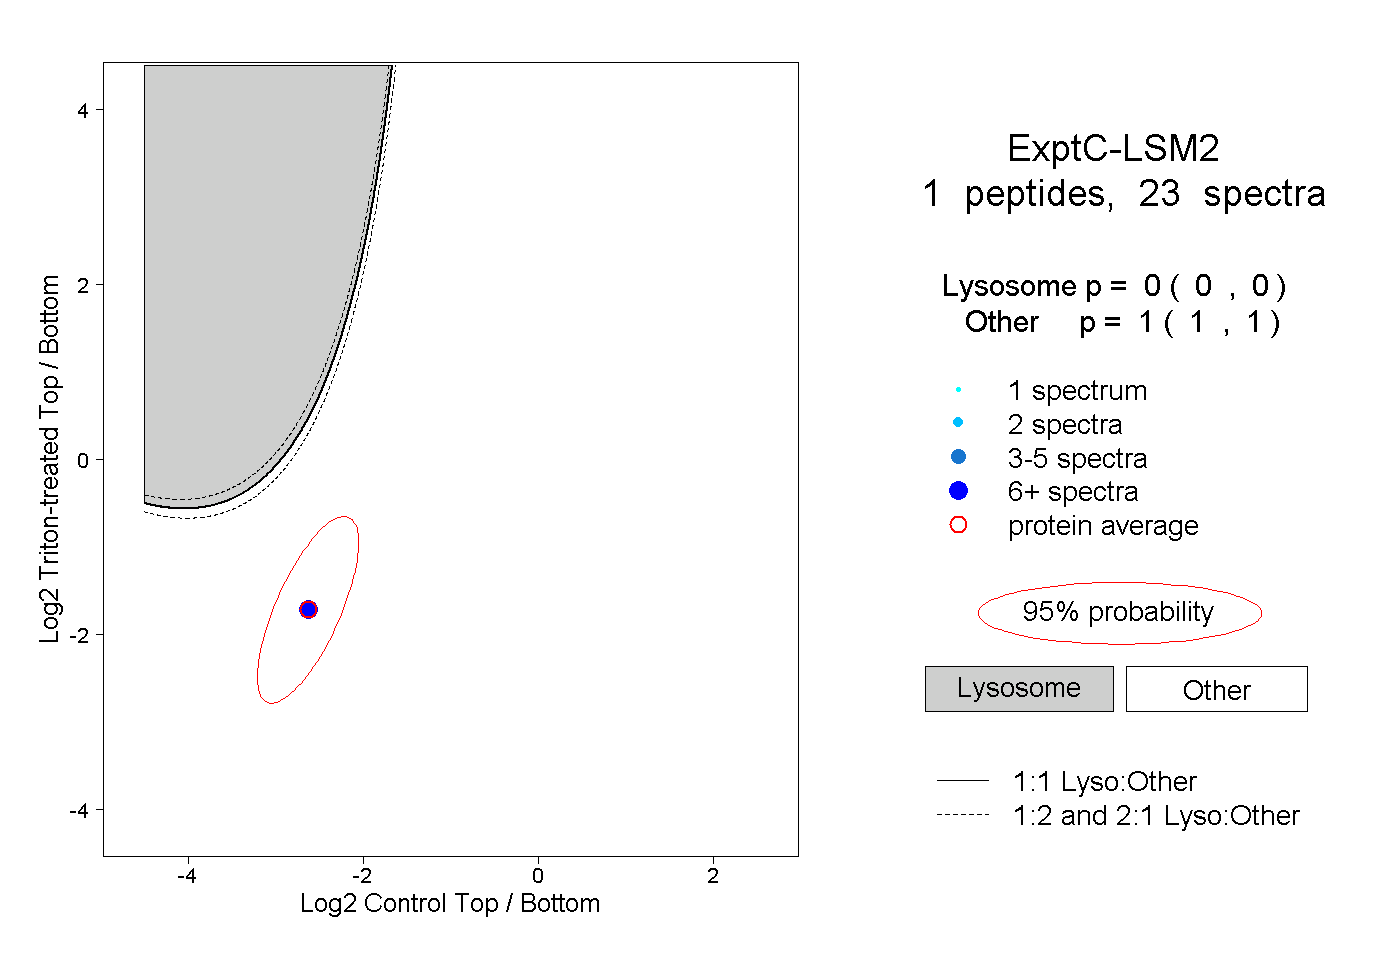
0.000 | 0.000
1.000 | 1.000
1peptide
spectrum
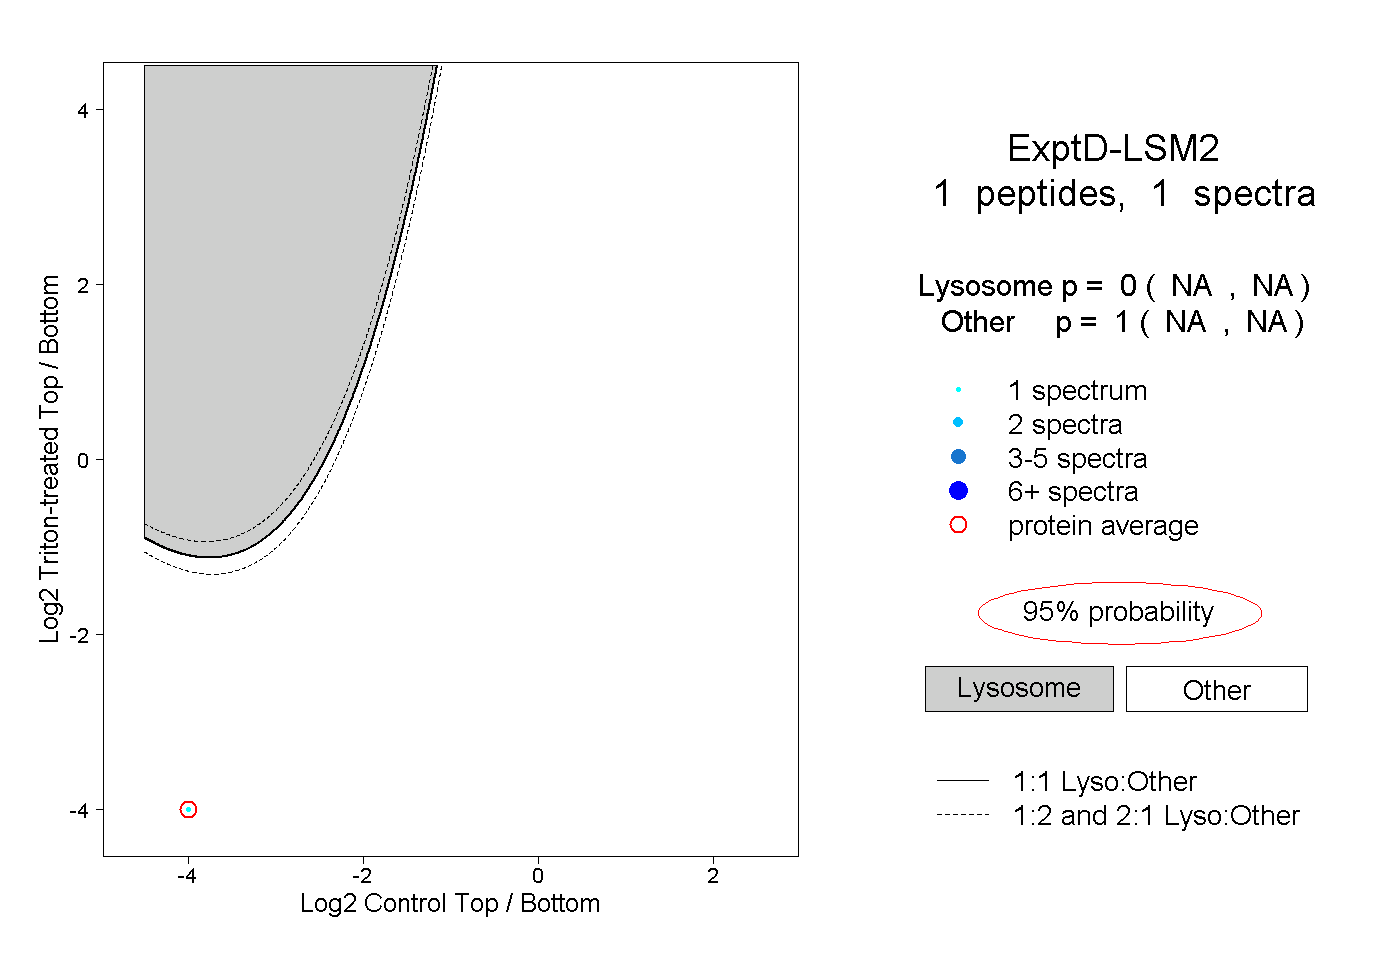
NA | NA
NA | NA