 3
3peptides
spectra
0.000 | 0.000
0.000 | 0.000
0.000 | 0.090
0.000 | 0.131
0.000 | 0.000
0.000 | 0.196
0.512 | 0.622
0.179 | 0.326
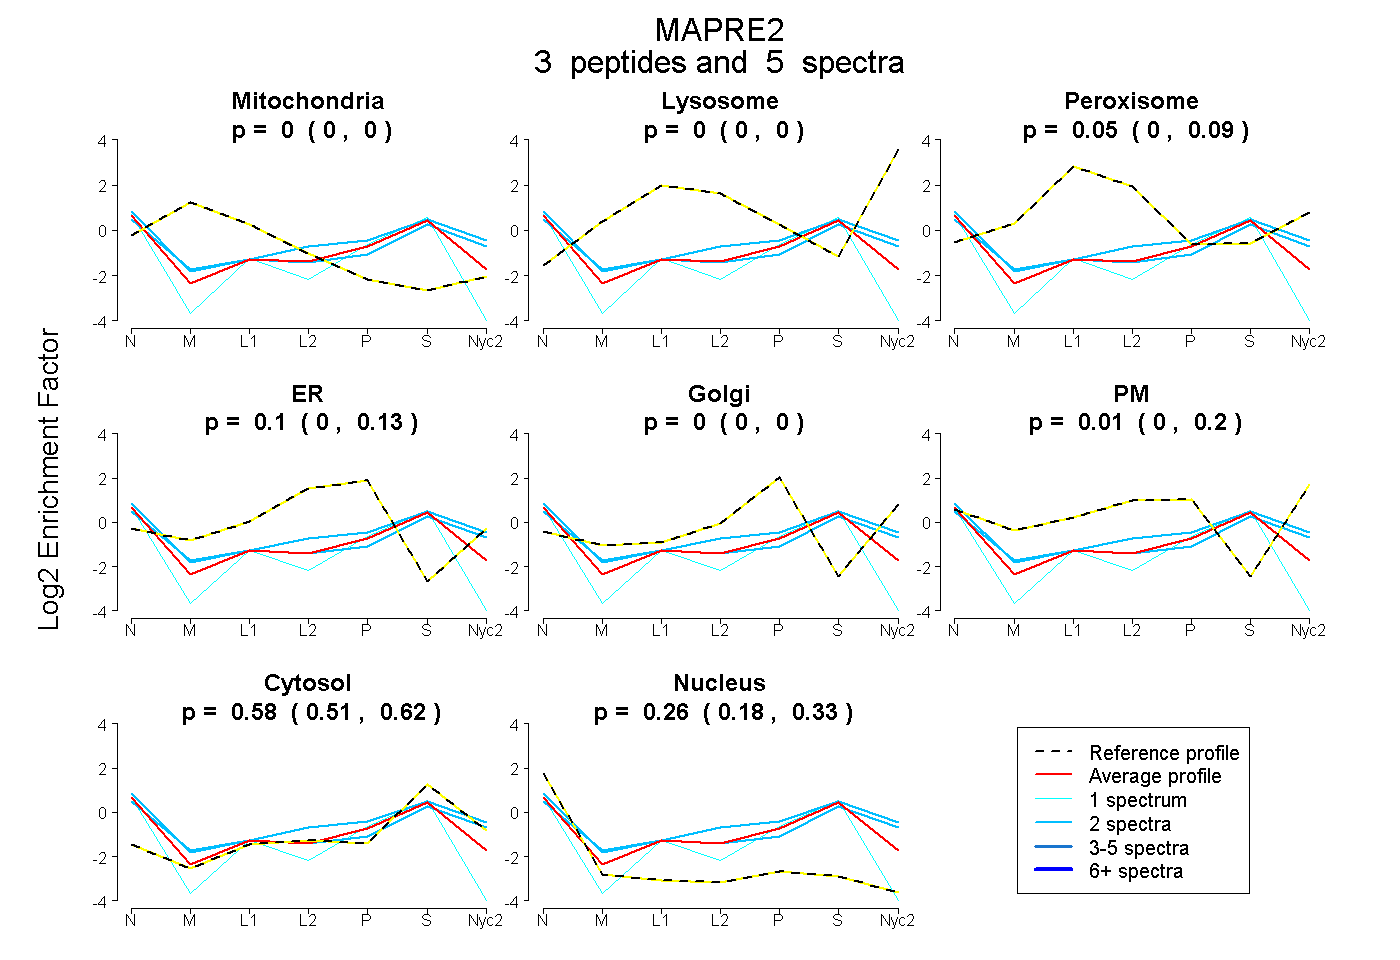
| Plot | Mito | Lyso | Perox | ER | Golgi | PM | Cytosol | Nucleus | |||||
| Expt A |
3 peptides |
5 spectra |
|
0.000 0.000 | 0.000 |
0.000 0.000 | 0.000 |
0.049 0.000 | 0.090 |
0.095 0.000 | 0.131 |
0.000 0.000 | 0.000 |
0.014 0.000 | 0.196 |
0.577 0.512 | 0.622 |
0.265 0.179 | 0.326 |
| 2 spectra, EYDPVEAR | 0.000 | 0.000 | 0.000 | 0.000 | 0.000 | 0.304 | 0.598 | 0.098 | ||
| 1 spectrum, EIELLCQEHGQENDDLVQR | 0.000 | 0.000 | 0.000 | 0.000 | 0.000 | 0.000 | 0.554 | 0.446 | ||
| 2 spectra, LALEGVEK | 0.000 | 0.000 | 0.033 | 0.000 | 0.000 | 0.205 | 0.535 | 0.227 |