 8
8peptides
spectra
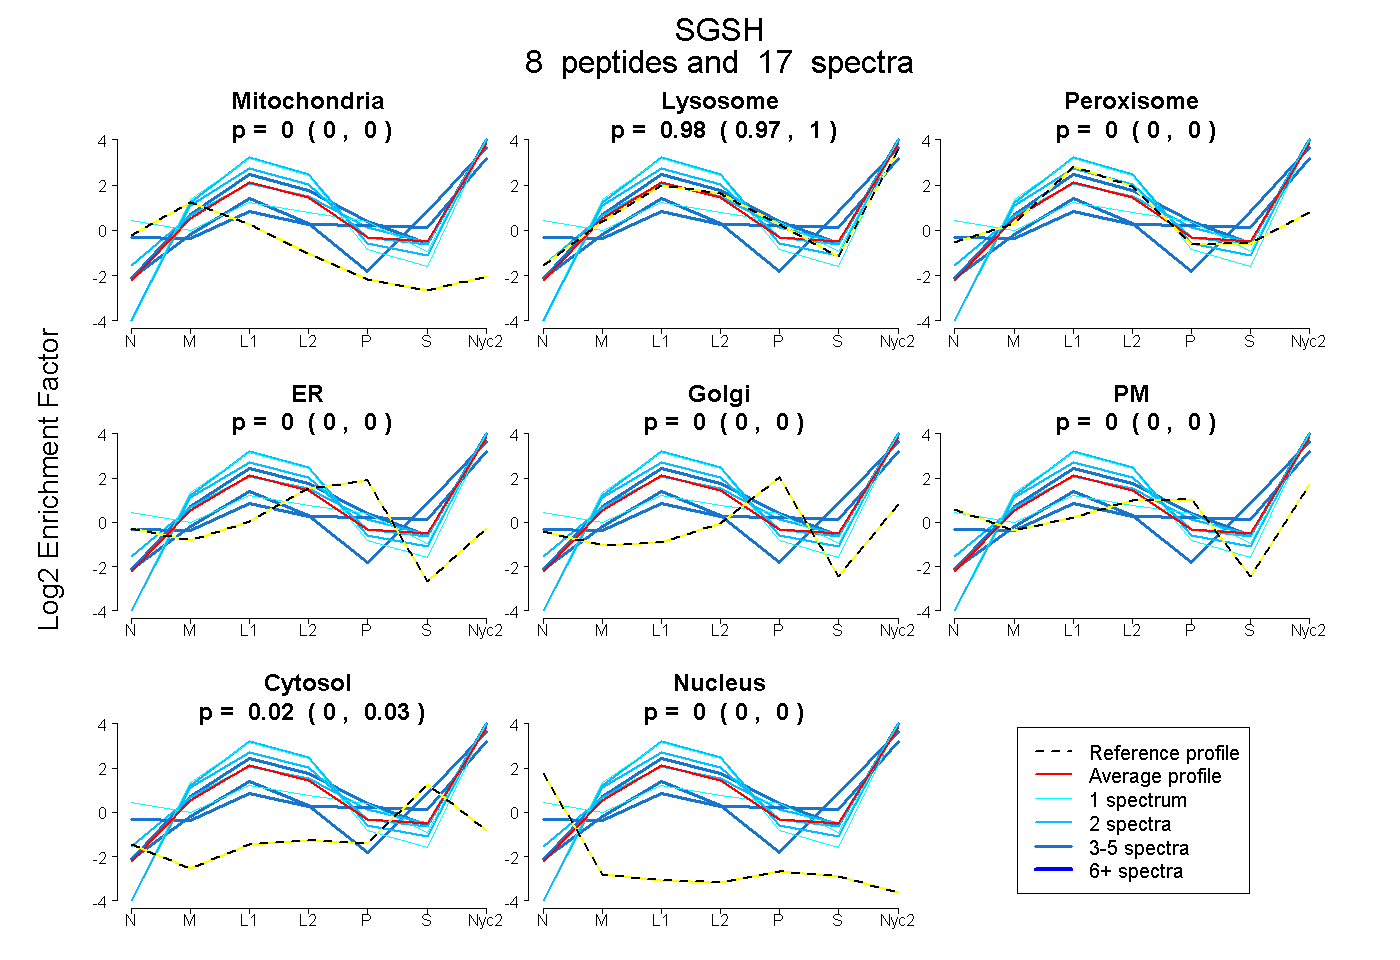
0.000 | 0.000
0.967 | 0.995
0.000 | 0.000
0.000 | 0.000
0.000 | 0.000
0.000 | 0.000
0.002 | 0.030
0.000 | 0.000
6peptides
spectra
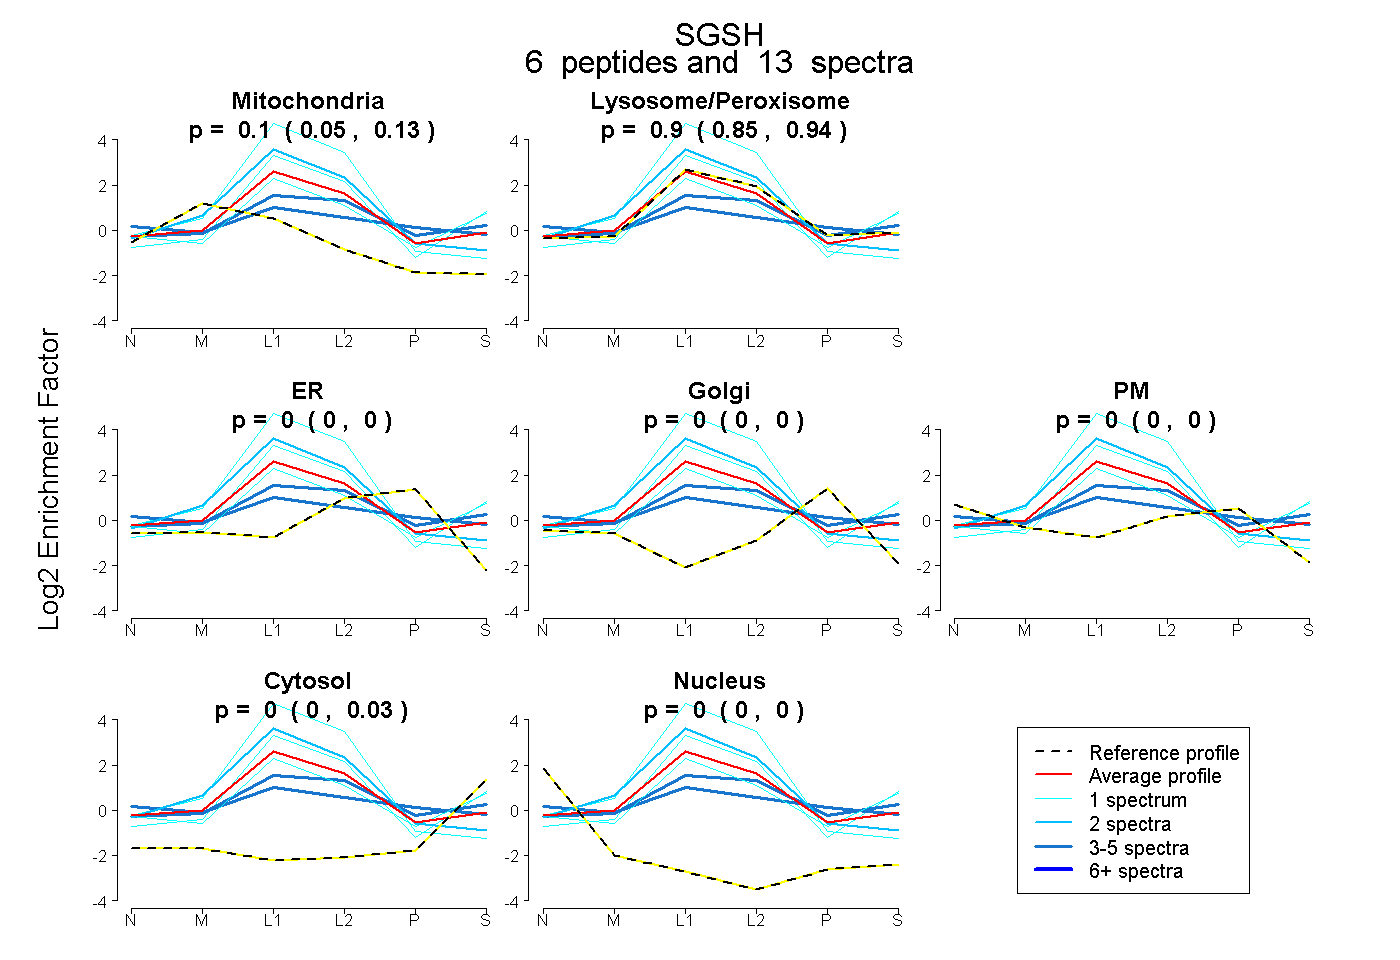
0.048 | 0.127
0.854 | 0.943
0.000 | 0.000
0.000 | 0.000
0.000 | 0.000
0.000 | 0.028
0.000 | 0.000
10peptides
spectra
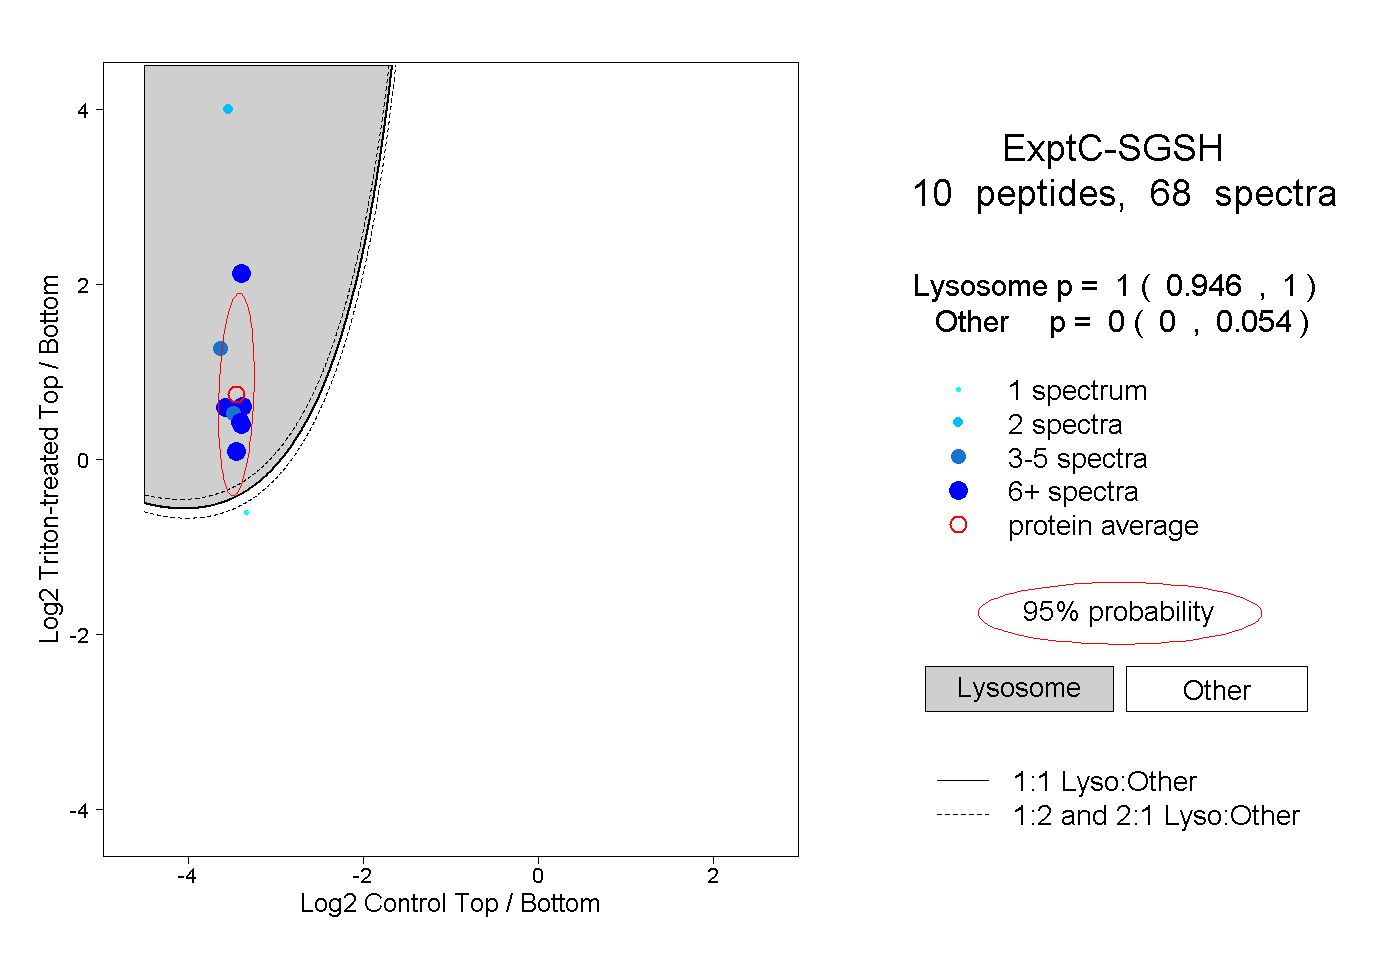
0.946 | 1.000
0.000 | 0.054
4peptides
spectra
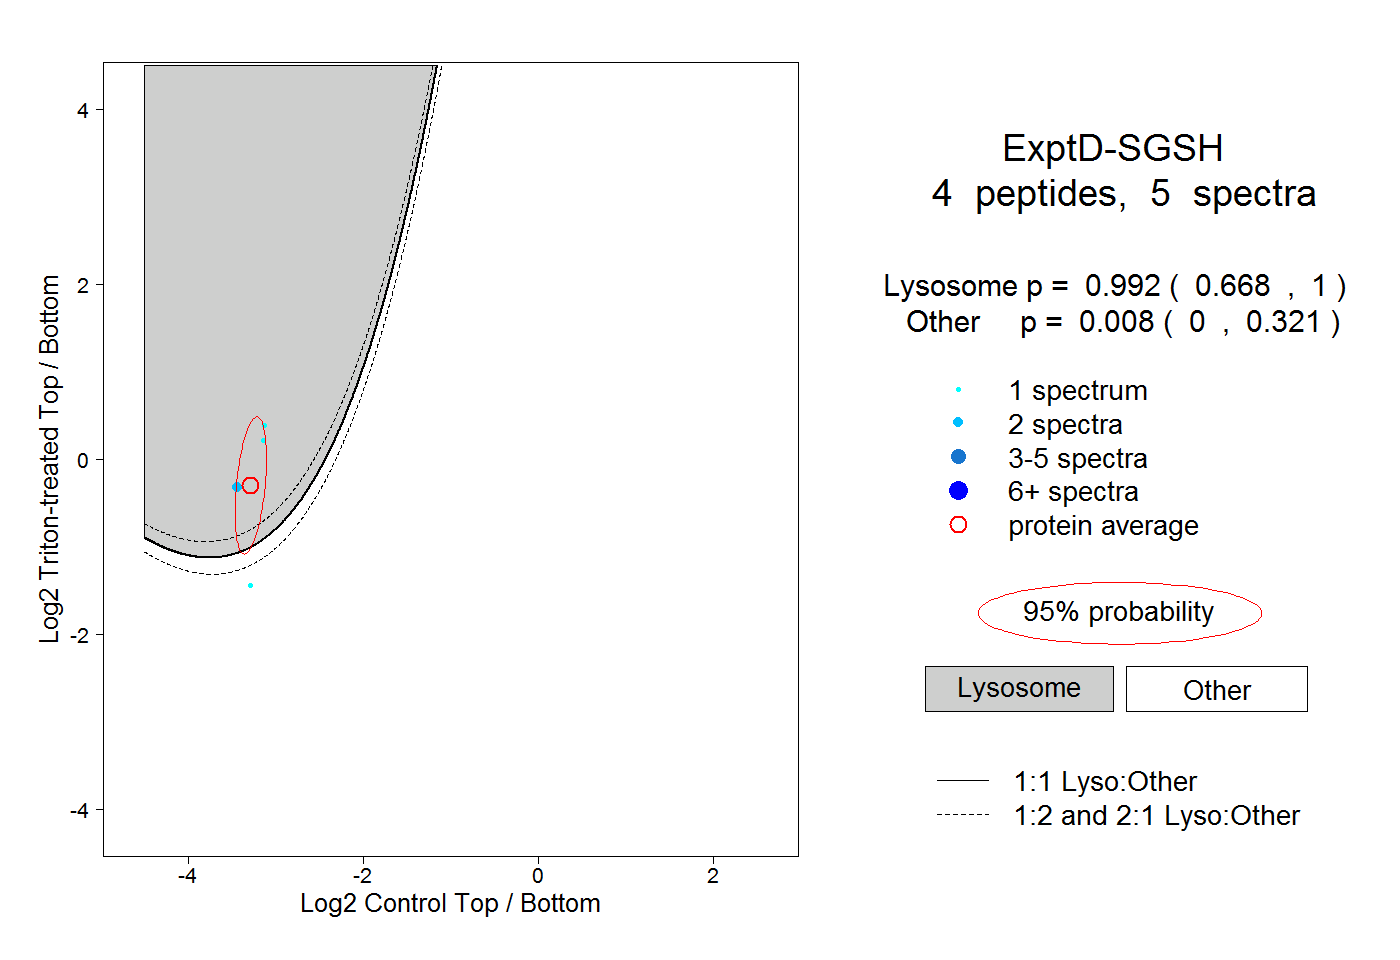
0.668 | 1.000
0.000 | 0.321