 9
9peptides
spectra
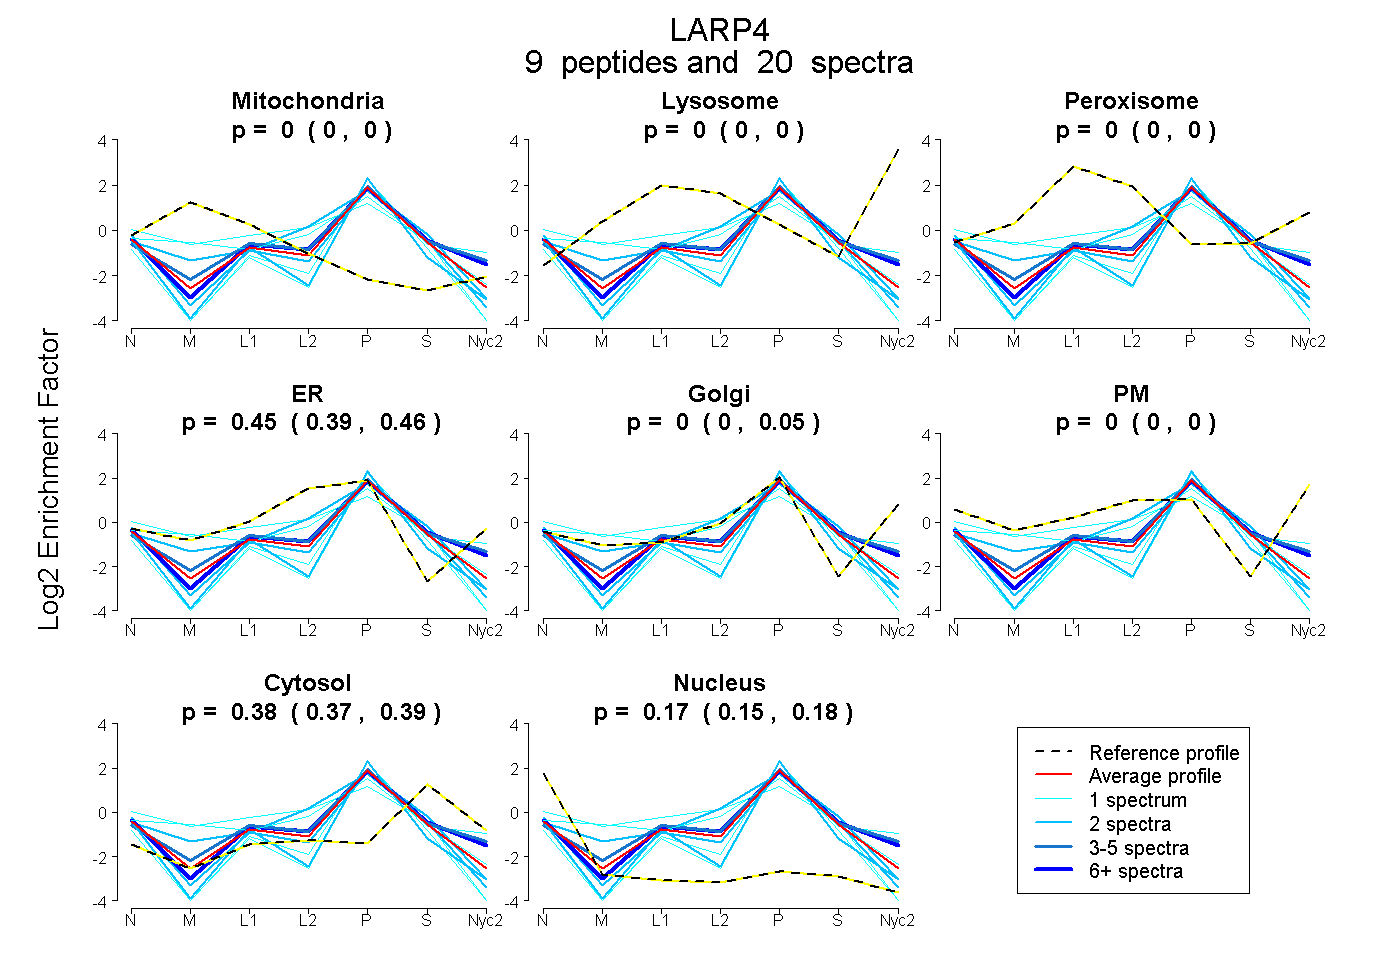
0.000 | 0.000
0.000 | 0.000
0.000 | 0.000
0.391 | 0.465
0.000 | 0.052
0.000 | 0.000
0.365 | 0.387
0.154 | 0.180
| Plot | Mito | Lyso | Perox | ER | Golgi | PM | Cytosol | Nucleus | |||||
| Expt A |
9 peptides |
20 spectra |
|
0.000 0.000 | 0.000 |
0.000 0.000 | 0.000 |
0.000 0.000 | 0.000 |
0.453 0.391 | 0.465 |
0.000 0.000 | 0.052 |
0.000 0.000 | 0.000 |
0.379 0.365 | 0.387 |
0.168 0.154 | 0.180 |
| 1 spectrum, EYEVMYSPSCEPTR | 0.167 | 0.000 | 0.000 | 0.472 | 0.000 | 0.000 | 0.219 | 0.142 | ||
| 6 spectra, MPDELALENR | 0.000 | 0.000 | 0.000 | 0.277 | 0.236 | 0.000 | 0.417 | 0.071 | ||
| 2 spectra, GTGLNPNAK | 0.000 | 0.000 | 0.000 | 0.346 | 0.000 | 0.000 | 0.434 | 0.219 | ||
| 1 spectrum, NENCPK | 0.071 | 0.000 | 0.000 | 0.544 | 0.000 | 0.000 | 0.309 | 0.076 | ||
| 2 spectra, SNVVSPTR | 0.000 | 0.000 | 0.000 | 0.088 | 0.328 | 0.000 | 0.263 | 0.321 | ||
| 4 spectra, MSDVVK | 0.000 | 0.000 | 0.000 | 0.267 | 0.302 | 0.000 | 0.400 | 0.031 | ||
| 1 spectrum, DAPILQMEQNGDFGR | 0.000 | 0.000 | 0.000 | 0.000 | 0.501 | 0.000 | 0.418 | 0.081 | ||
| 2 spectra, LTTDPDLILEVLR | 0.000 | 0.000 | 0.000 | 0.557 | 0.000 | 0.000 | 0.301 | 0.142 | ||
| 1 spectrum, FDLLATNFPPLPGSSSR | 0.000 | 0.000 | 0.000 | 0.215 | 0.076 | 0.000 | 0.325 | 0.384 |
| Plot | Mito | Lyso or Perox | ER | Golgi | PM | Cytosol | Nucleus | ||||||
| Expt B |
4 peptides |
5 spectra |
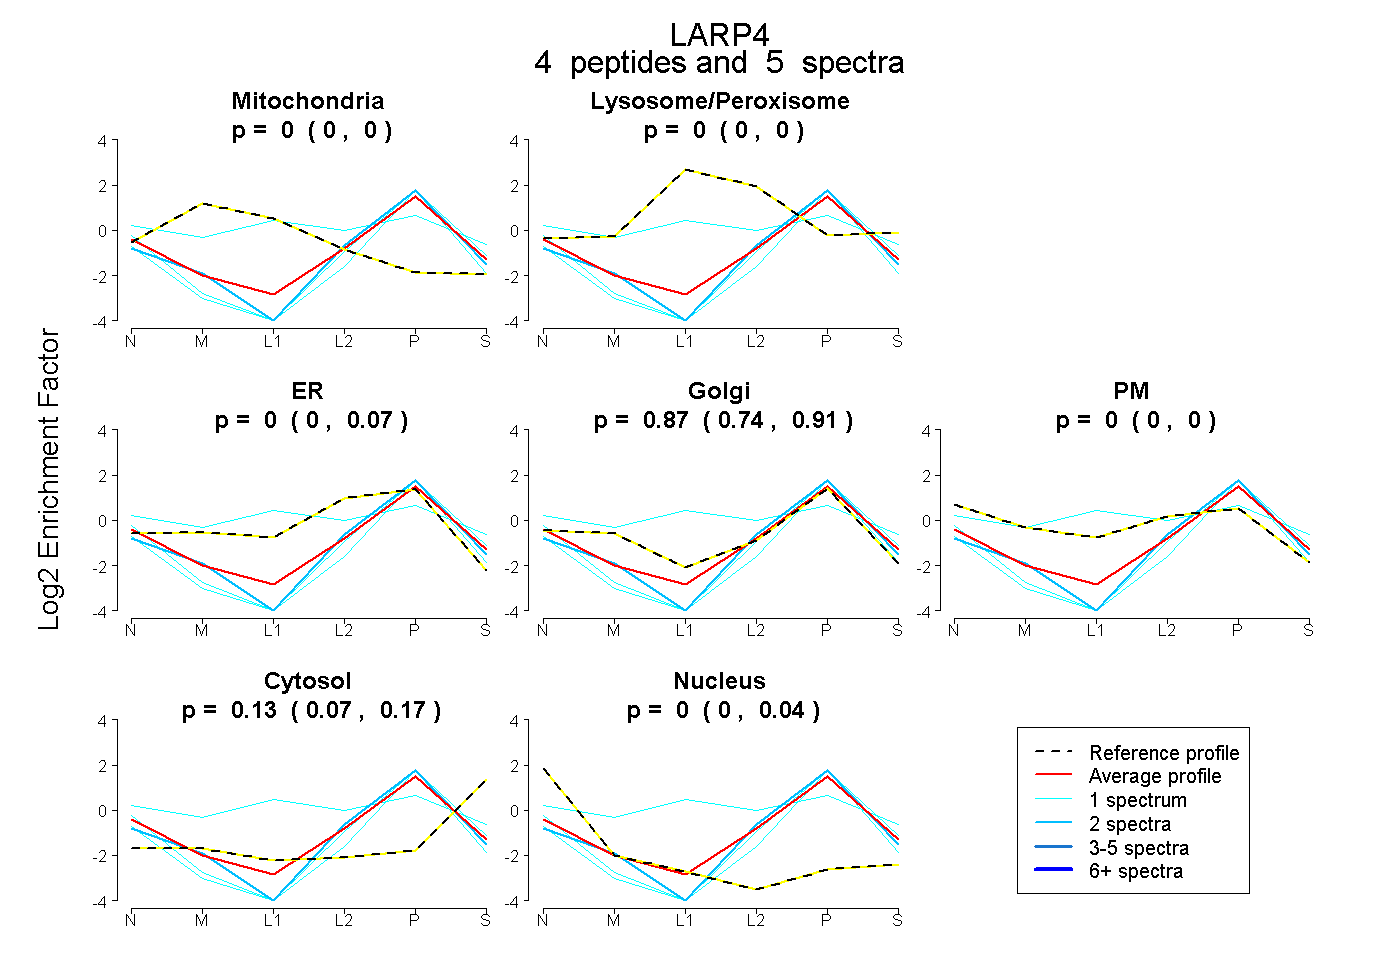 |
0.000 0.000 | 0.000 |
0.000 0.000 | 0.000 |
0.000 0.000 | 0.071 |
0.870 0.745 | 0.912 |
0.000 0.000 | 0.000 |
0.130 0.071 | 0.169 |
0.000 0.000 | 0.045 |
|||
| Plot | Lyso | Other | |||||||||||
| Expt C |
6 peptides |
13 spectra |
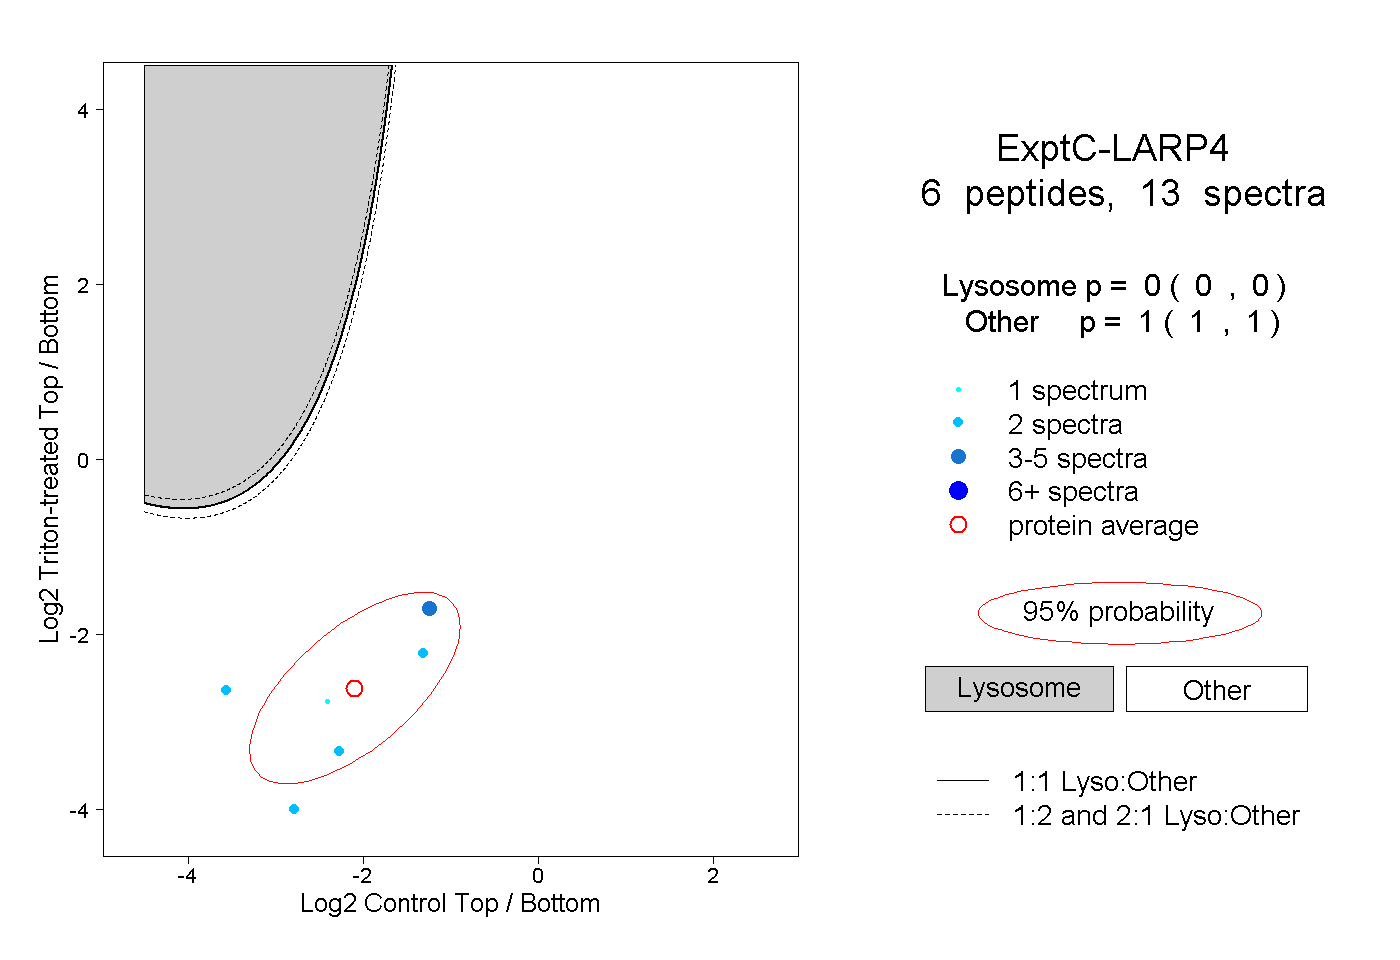 |
0.000 0.000 | 0.000 |
1.000 1.000 | 1.000 |
||||||||
| Plot | Lyso | Other | |||||||||||
| Expt D |
1 peptide |
3 spectra |
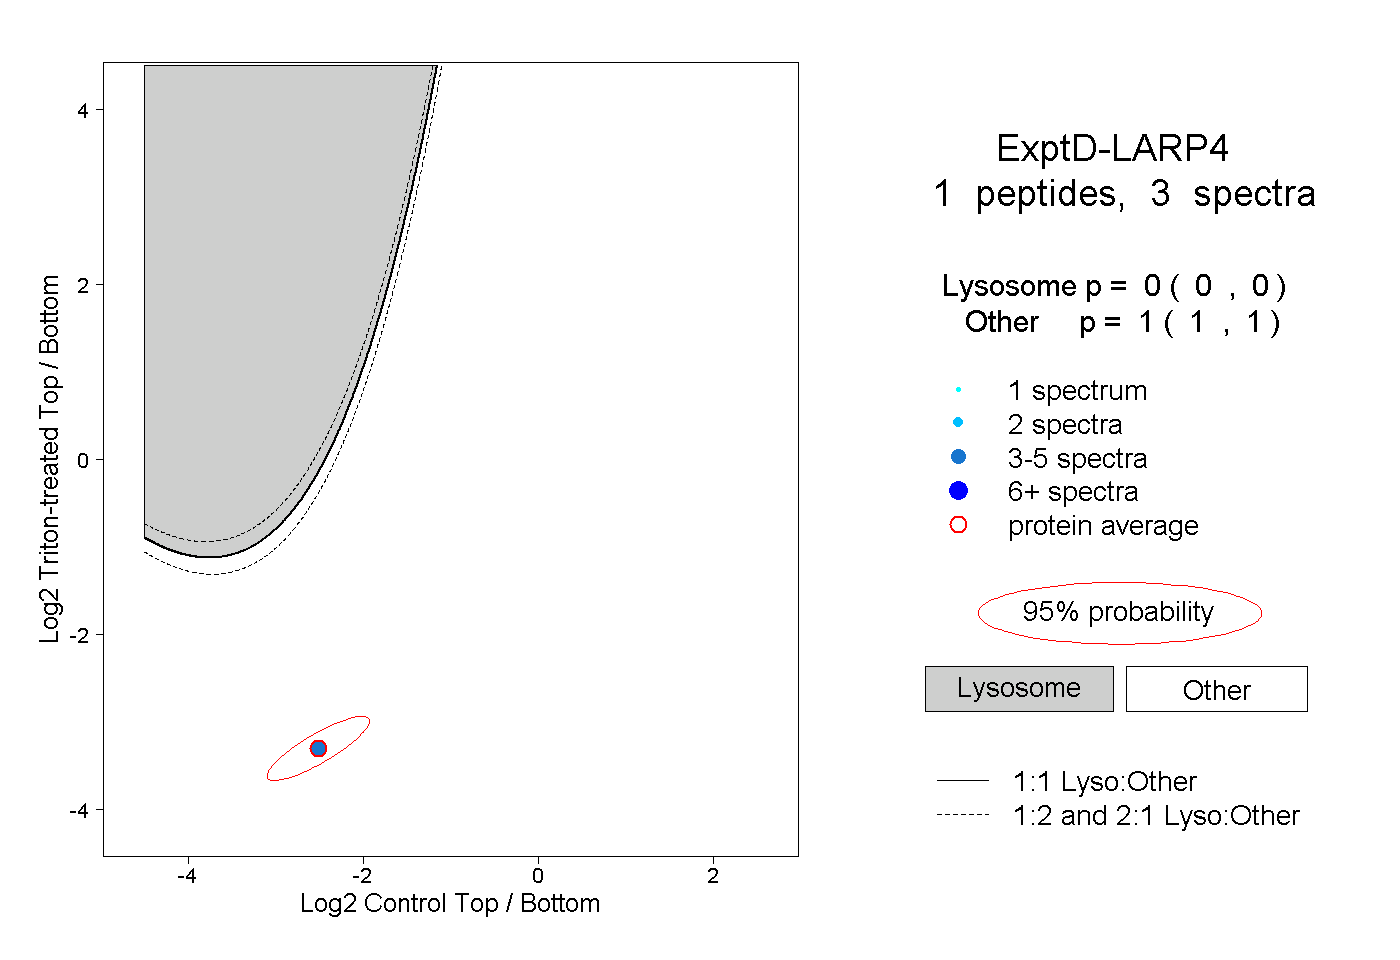 |
0.000 0.000 | 0.000 |
1.000 1.000 | 1.000 |