 2
2peptides
spectra
0.000 | 0.220
0.000 | 0.000
0.000 | 0.184
0.000 | 0.411
0.000 | 0.341
0.000 | 0.311
0.000 | 0.100
0.379 | 0.604
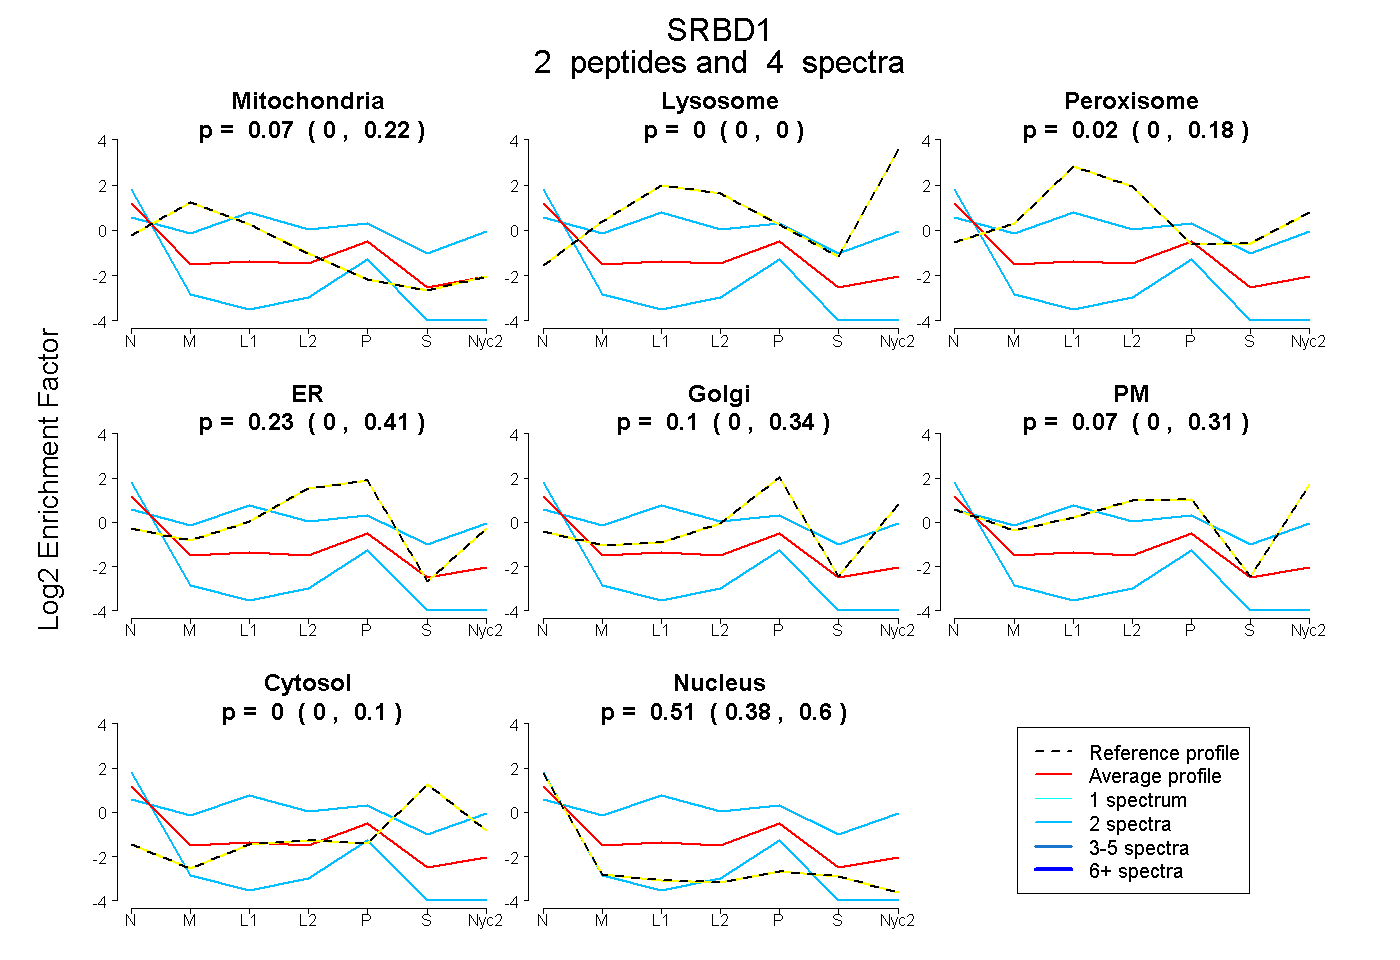
| Plot | Mito | Lyso | Perox | ER | Golgi | PM | Cytosol | Nucleus | |||||
| Expt A |
2 peptides |
4 spectra |
|
0.072 0.000 | 0.220 |
0.000 0.000 | 0.000 |
0.017 0.000 | 0.184 |
0.227 0.000 | 0.411 |
0.103 0.000 | 0.341 |
0.070 0.000 | 0.311 |
0.000 0.000 | 0.100 |
0.512 0.379 | 0.604 |