 5
5peptides
spectra
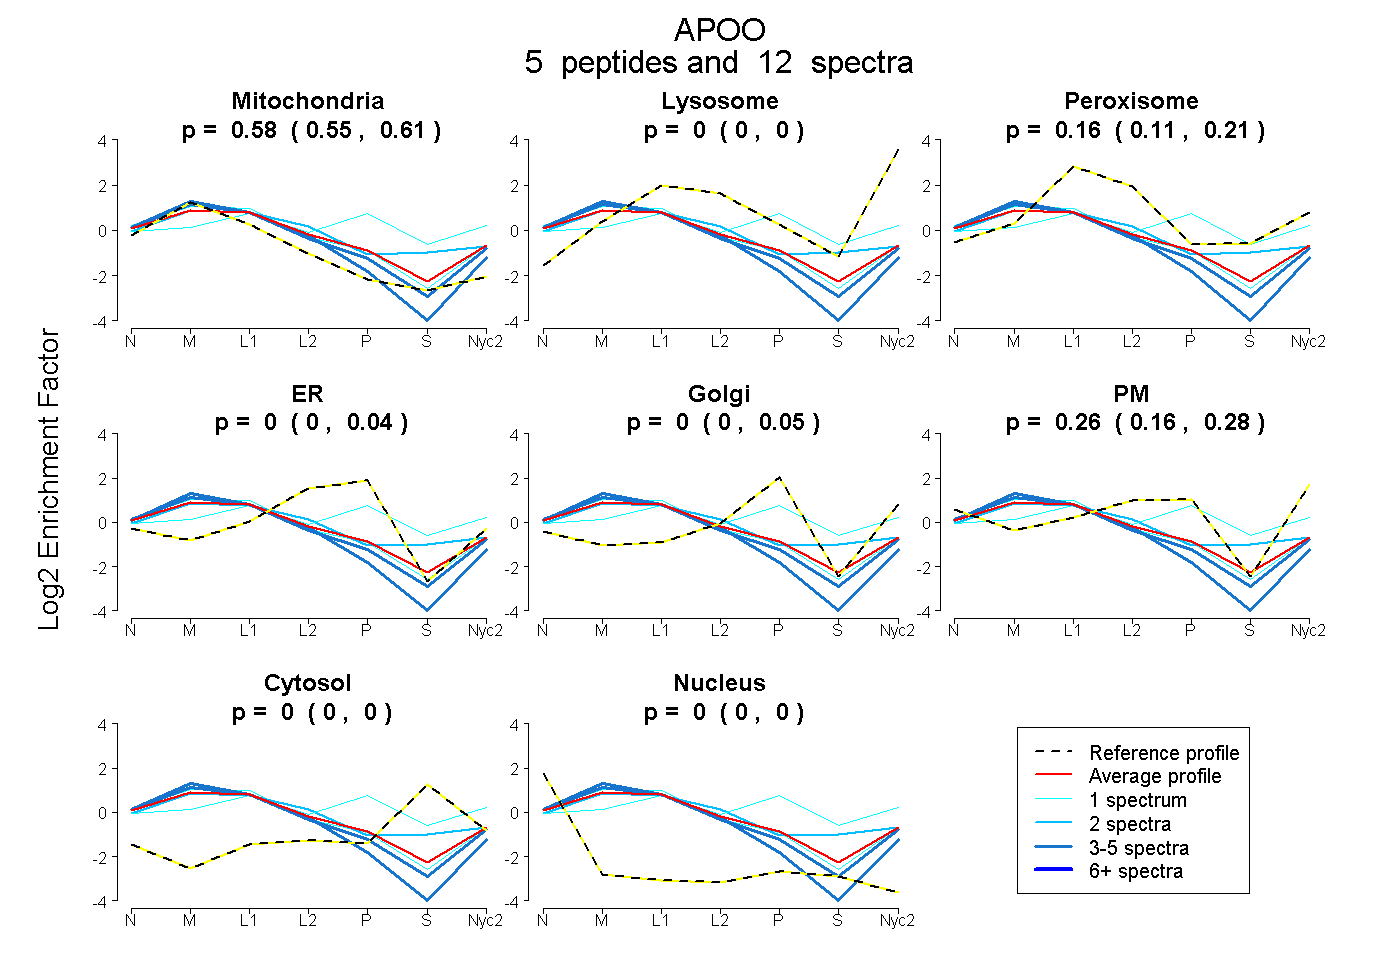
0.546 | 0.608
0.000 | 0.001
0.111 | 0.209
0.000 | 0.045
0.000 | 0.055
0.162 | 0.285
0.000 | 0.000
0.000 | 0.000
4peptides
spectra
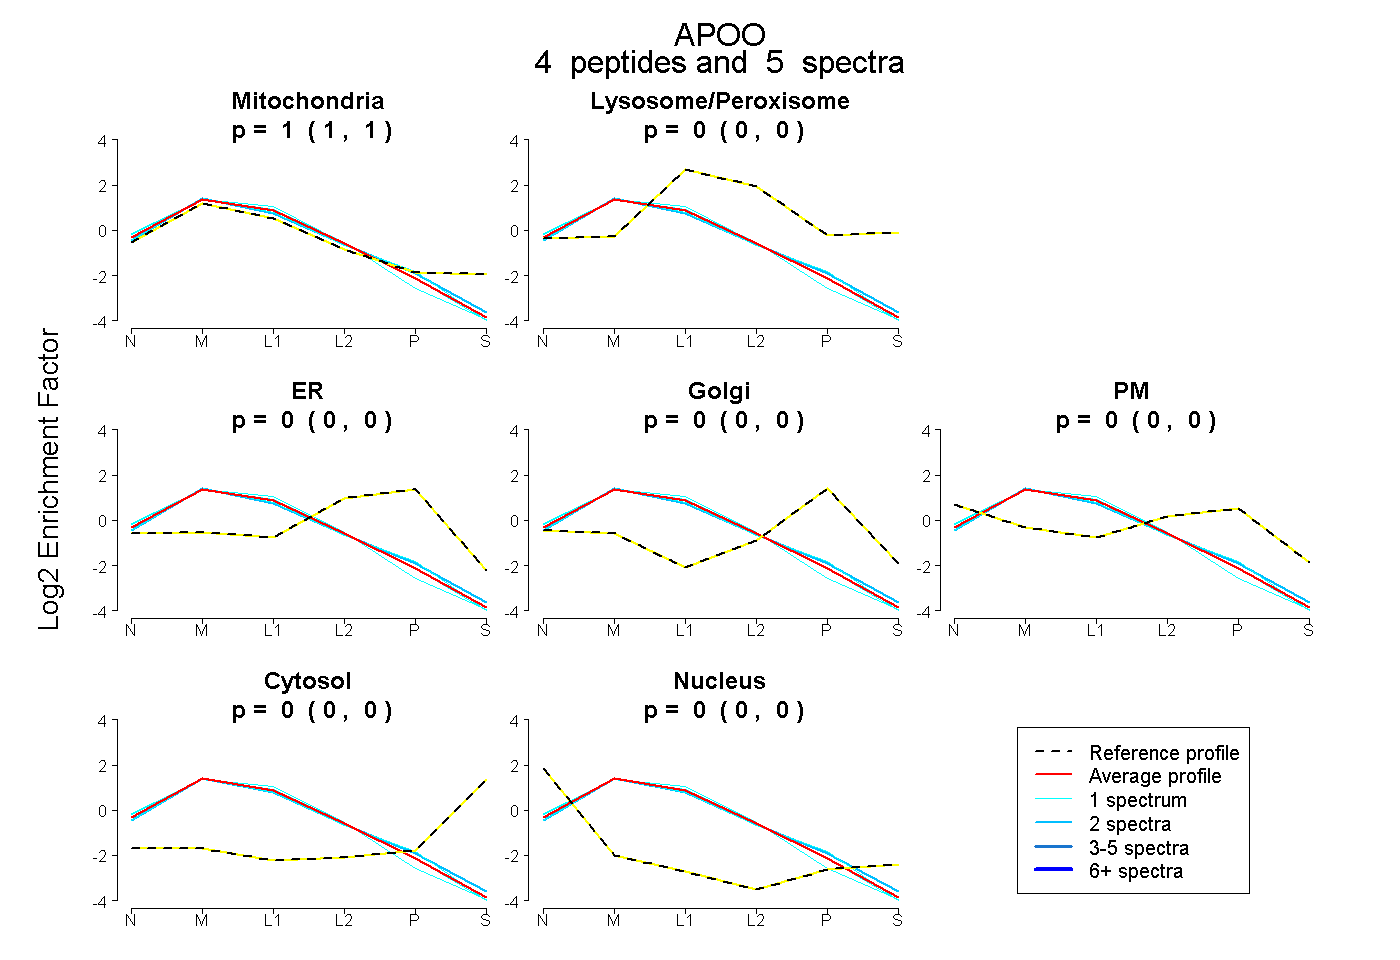
1.000 | 1.000
0.000 | 0.000
0.000 | 0.000
0.000 | 0.000
0.000 | 0.000
0.000 | 0.000
0.000 | 0.000
6peptides
spectra
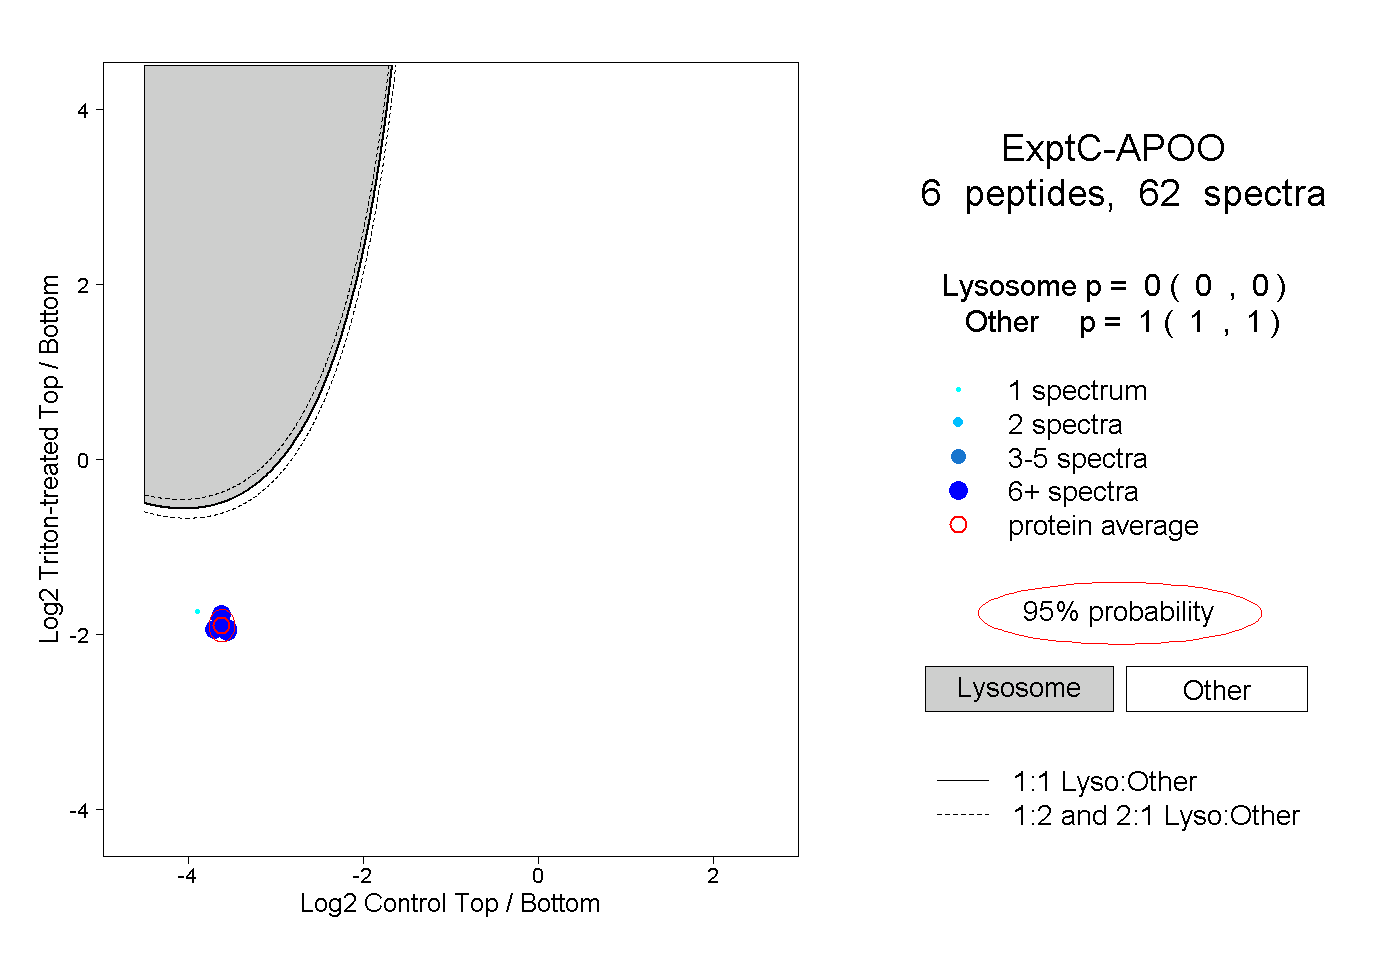
0.000 | 0.000
1.000 | 1.000
3peptides
spectra
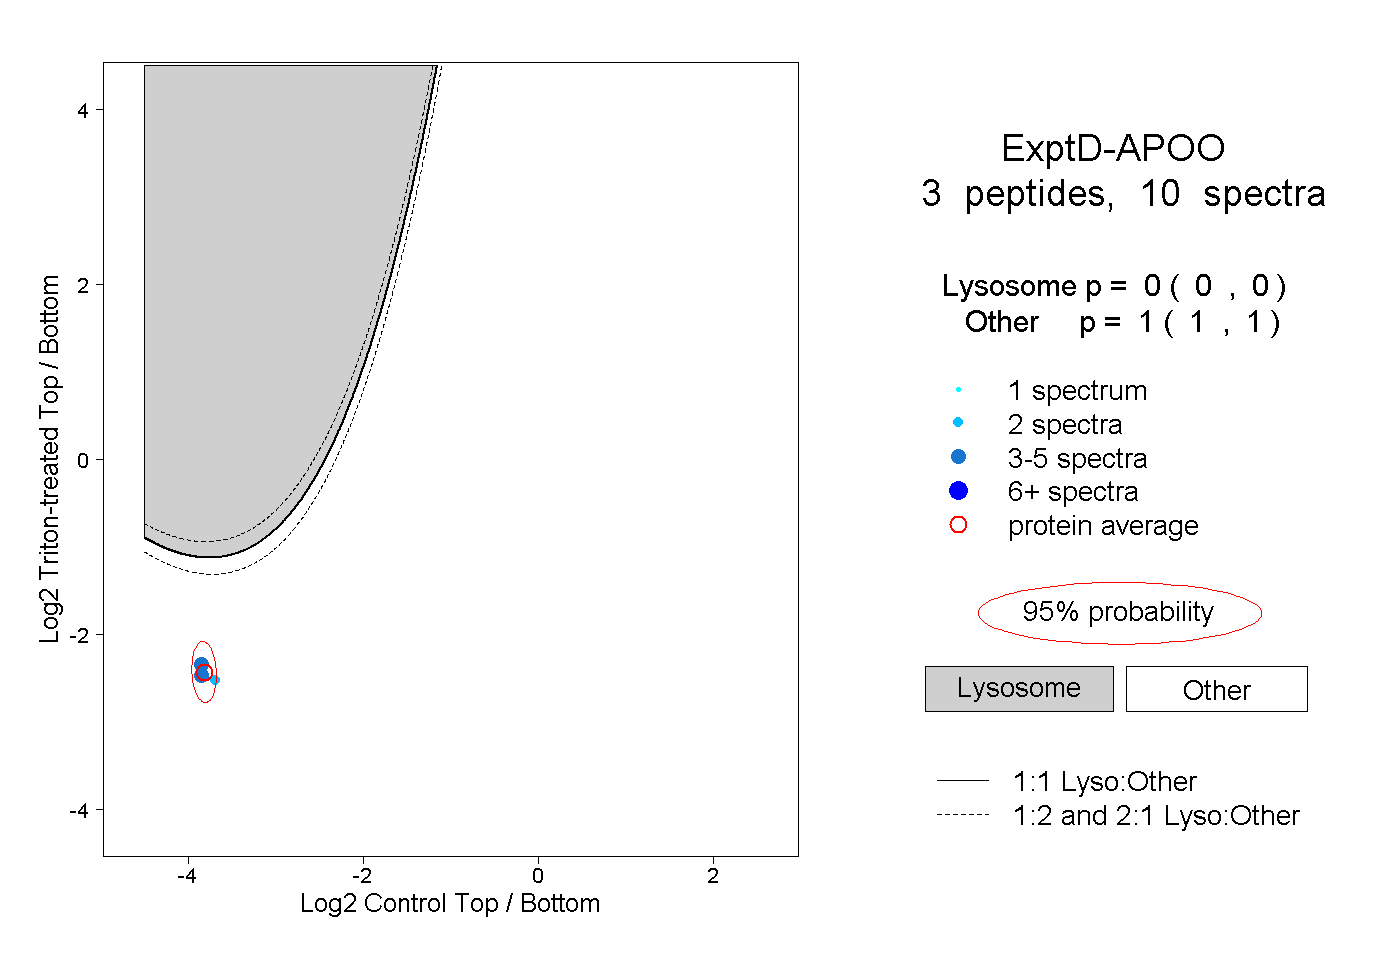
0.000 | 0.000
1.000 | 1.000