10
10peptides
spectra
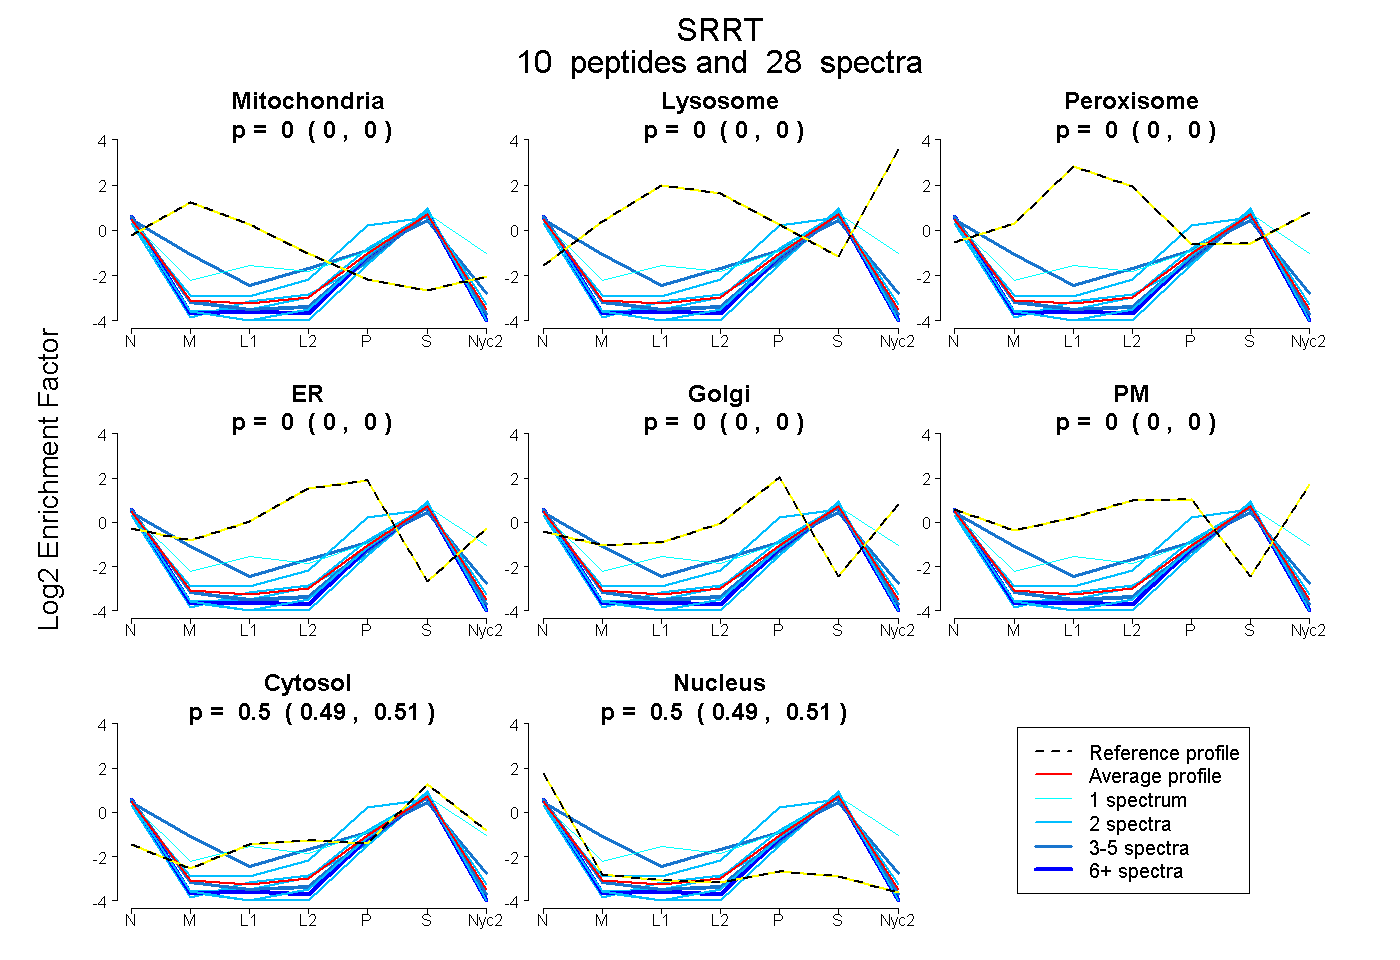
0.000 | 0.000
0.000 | 0.000
0.000 | 0.000
0.000 | 0.000
0.000 | 0.000
0.000 | 0.000
0.490 | 0.507
0.492 | 0.507
4peptides
spectra
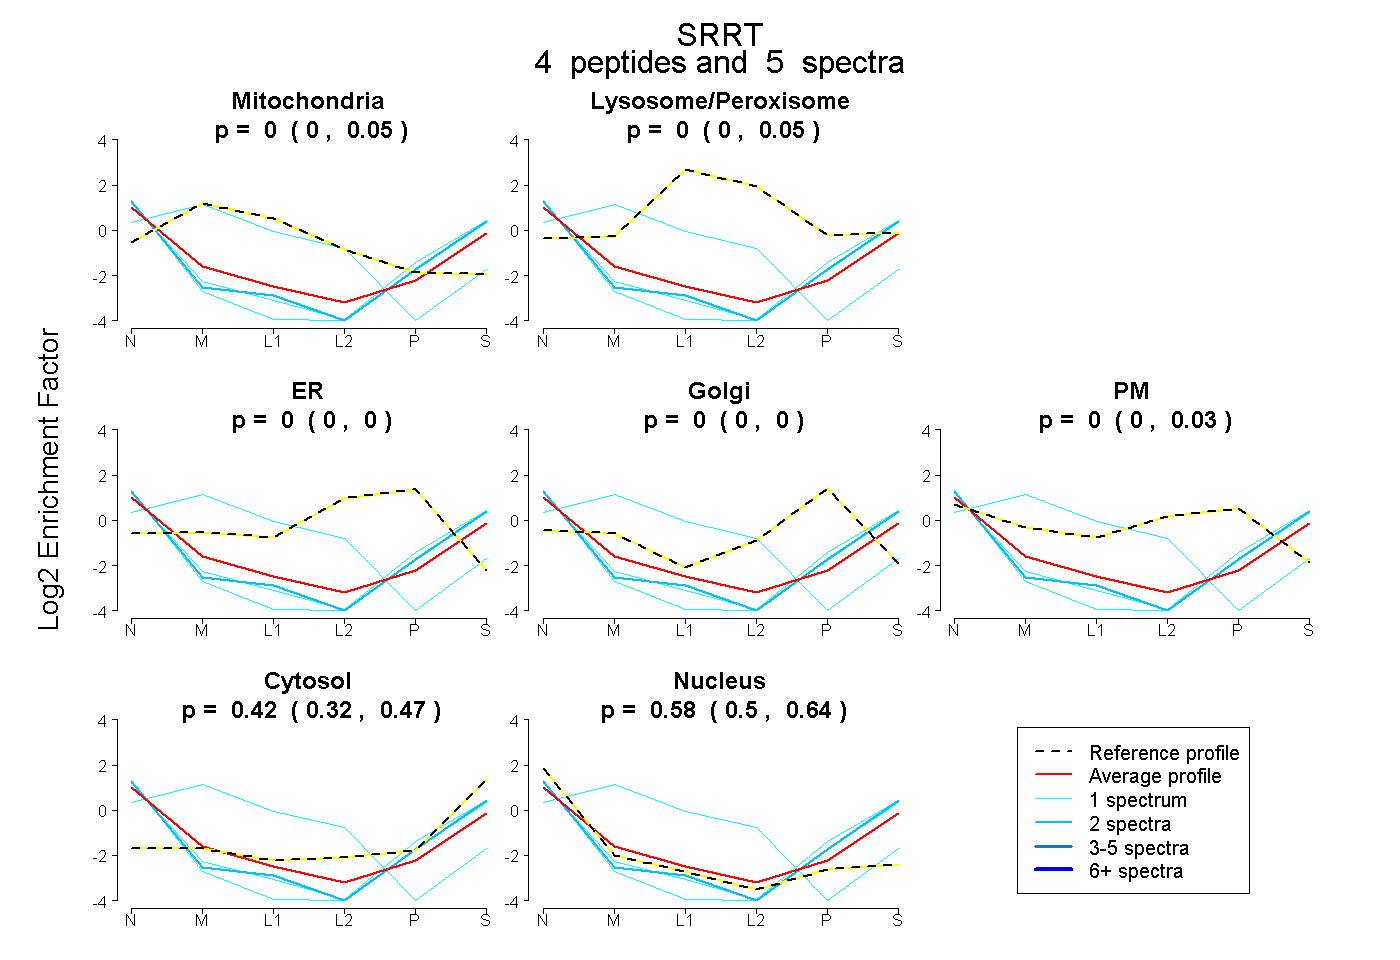
0.000 | 0.050
0.000 | 0.052
0.000 | 0.000
0.000 | 0.000
0.000 | 0.029
0.320 | 0.467
0.496 | 0.643