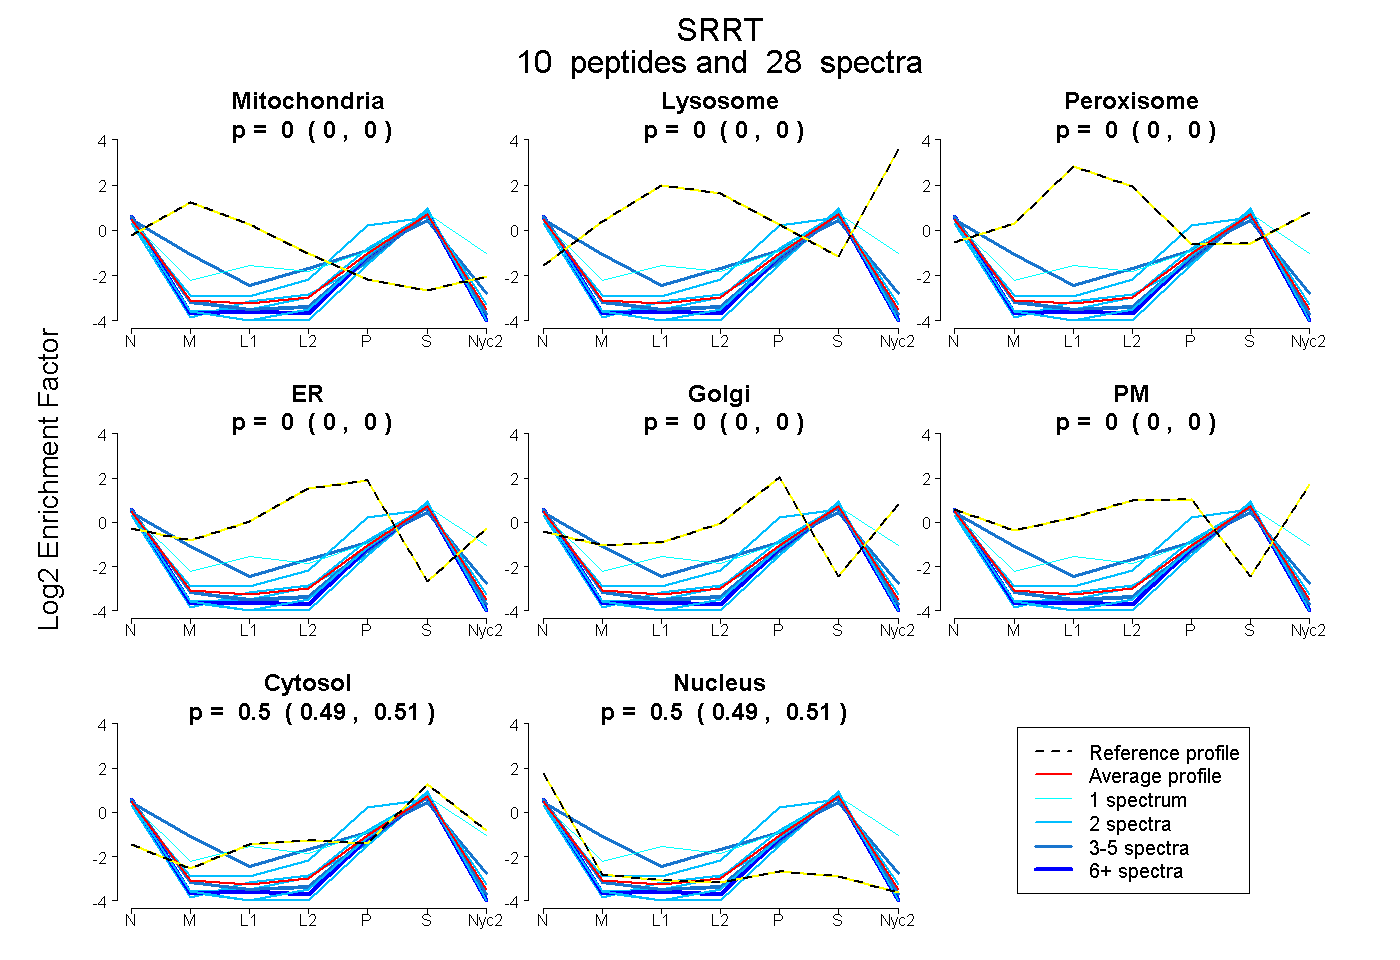
 10
10peptides
spectra
0.000 | 0.000
0.000 | 0.000
0.000 | 0.000
0.000 | 0.000
0.000 | 0.000
0.000 | 0.000
0.490 | 0.507
0.492 | 0.507
| Plot | Mito | Lyso | Perox | ER | Golgi | PM | Cytosol | Nucleus | |||||
| Expt A |
10 peptides |
28 spectra |
|
0.000 0.000 | 0.000 |
0.000 0.000 | 0.000 |
0.000 0.000 | 0.000 |
0.000 0.000 | 0.000 |
0.000 0.000 | 0.000 |
0.000 0.000 | 0.000 |
0.500 0.490 | 0.507 |
0.500 0.492 | 0.507 |
| 2 spectra, ESLSEEEAQK | 0.000 | 0.000 | 0.000 | 0.000 | 0.000 | 0.000 | 0.508 | 0.492 | ||
| 1 spectrum, VSHGEVLEWQK | 0.000 | 0.000 | 0.000 | 0.000 | 0.000 | 0.108 | 0.691 | 0.201 | ||
| 3 spectra, NIAPNISR | 0.000 | 0.000 | 0.000 | 0.000 | 0.000 | 0.000 | 0.444 | 0.556 | ||
| 6 spectra, LTPLLSVR | 0.000 | 0.000 | 0.000 | 0.000 | 0.000 | 0.000 | 0.406 | 0.594 | ||
| 2 spectra, WLCPLSGK | 0.000 | 0.000 | 0.000 | 0.000 | 0.000 | 0.000 | 0.420 | 0.580 | ||
| 2 spectra, GPMPPNR | 0.000 | 0.000 | 0.000 | 0.017 | 0.000 | 0.000 | 0.569 | 0.414 | ||
| 2 spectra, EGNPAEINVER | 0.000 | 0.000 | 0.000 | 0.000 | 0.000 | 0.000 | 0.491 | 0.509 | ||
| 2 spectra, EVAFFNNFLTDAK | 0.000 | 0.000 | 0.000 | 0.000 | 0.000 | 0.000 | 0.381 | 0.619 | ||
| 4 spectra, LIHTLDDR | 0.000 | 0.000 | 0.000 | 0.000 | 0.000 | 0.000 | 0.421 | 0.579 | ||
| 4 spectra, CGIIHVR | 0.107 | 0.000 | 0.000 | 0.035 | 0.000 | 0.000 | 0.536 | 0.322 |
| Plot | Mito | Lyso or Perox | ER | Golgi | PM | Cytosol | Nucleus | ||||||
| Expt B |
4 peptides |
5 spectra |
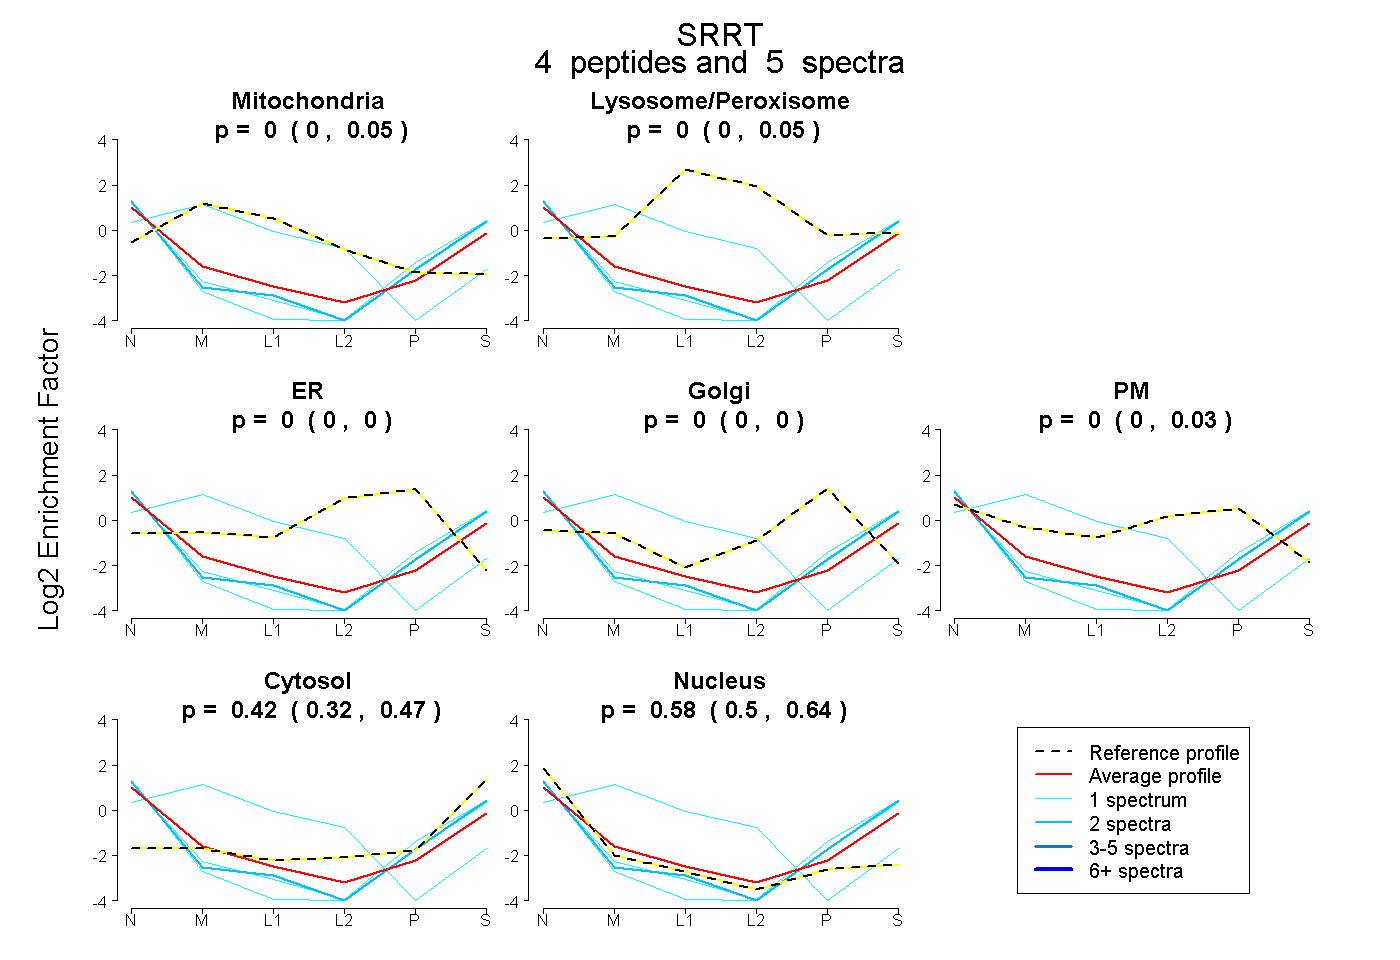 |
0.000 0.000 | 0.050 |
0.000 0.000 | 0.052 |
0.000 0.000 | 0.000 |
0.000 0.000 | 0.000 |
0.000 0.000 | 0.029 |
0.417 0.320 | 0.467 |
0.583 0.496 | 0.643 |
|||
| Plot | Lyso | Other | |||||||||||
| Expt D |
1 peptide |
2 spectra |
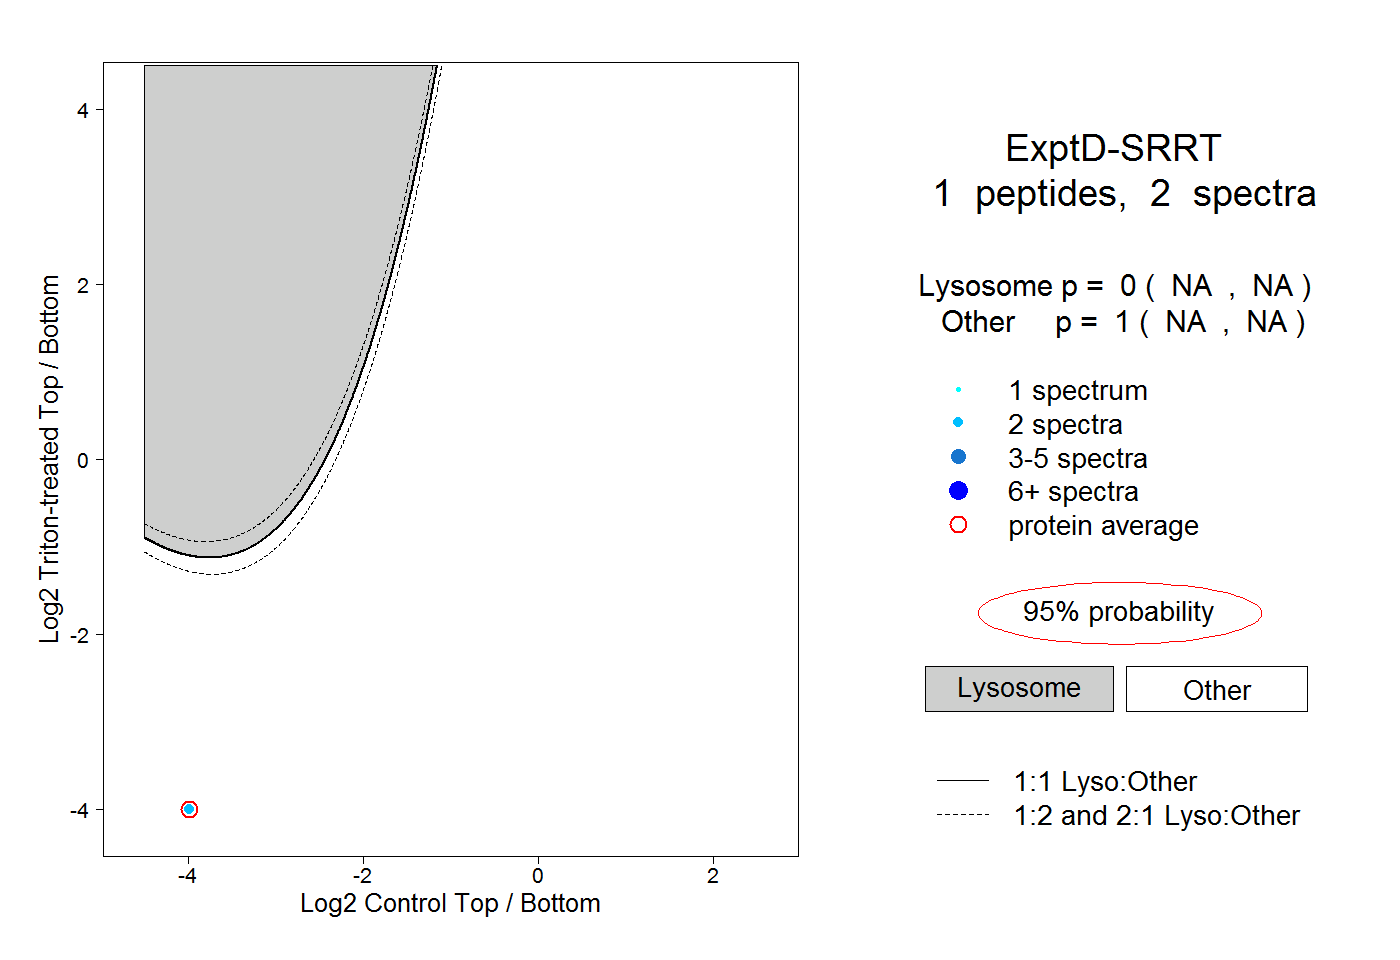 |
0.000 NA | NA |
1.000 NA | NA |