WBSCR27
[ENSRNOP00000065369]
Main page
| | | Plot |
Mito |
Lyso |
|
Perox |
ER |
Golgi |
PM |
Cytosol |
Nucleus |
|
| Expt A |
 6
6
peptides |
12
spectra |
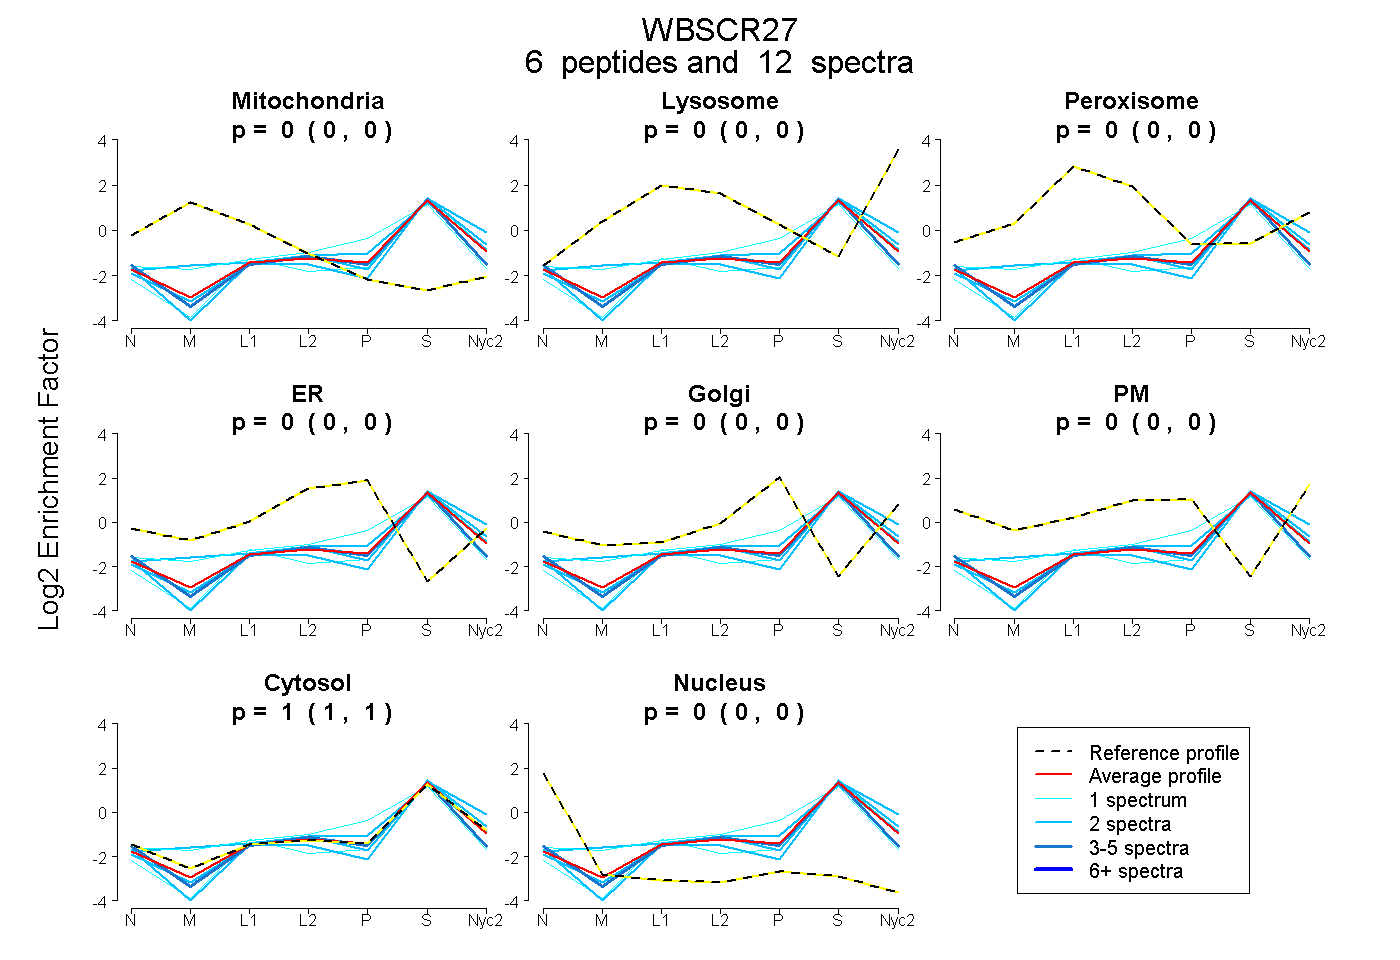 |
0.000
0.000 | 0.000 |
0.000
0.000 | 0.000 |
|
0.000
0.000 | 0.000 |
0.000
0.000 | 0.000 |
0.000
0.000 | 0.000 |
0.000
0.000 | 0.000 |
1.000
1.000 | 1.000 |
0.000
0.000 | 0.000 |
|
| | | Plot |
Mito |
|
Lyso or Perox |
|
ER |
Golgi |
PM |
Cytosol |
Nucleus |
|
| Expt B |
3
peptides |
4
spectra |
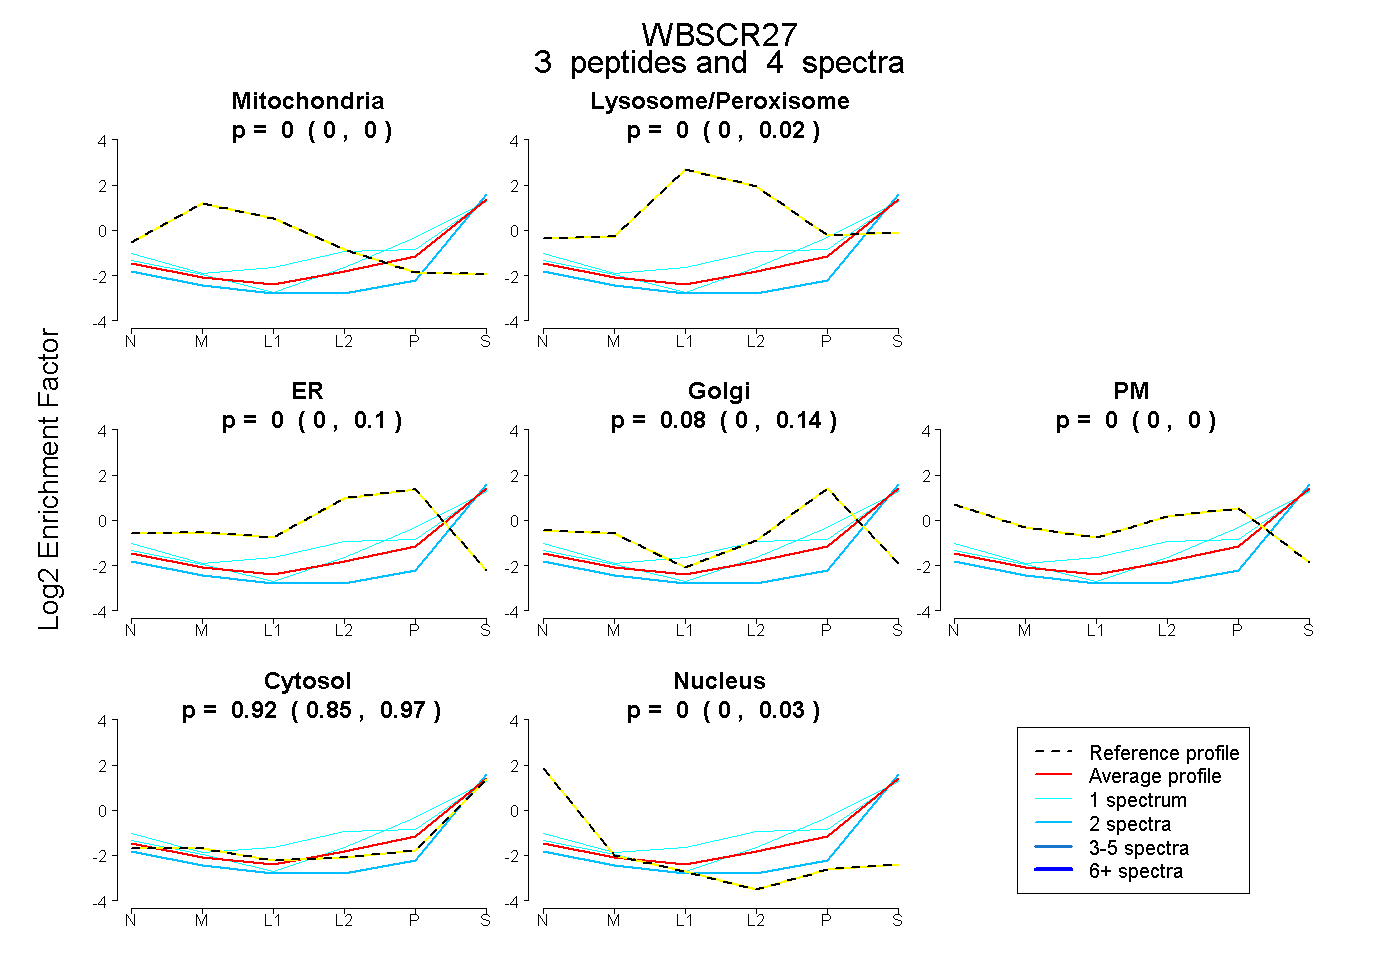 |
0.000
0.000 | 0.000 |
|
0.000
0.000 | 0.023 |
|
0.000
0.000 | 0.096 |
0.081
0.000 | 0.136 |
0.000
0.000 | 0.000 |
0.919
0.846 | 0.969 |
0.000
0.000 | 0.028 |
|
| 1 spectrum, LSIQPLIDH |
0.000 |
|
0.131 |
|
0.099 |
0.000 |
0.000 |
0.770 |
0.000 |
|
| 1 spectrum, LPQVLAR |
0.000 |
|
0.000 |
|
0.000 |
0.220 |
0.000 |
0.780 |
0.000 |
|
| 2 spectra, VTKPGGLVCLTTR |
0.000 |
|
0.000 |
|
0.000 |
0.000 |
0.000 |
0.975 |
0.025 |
|
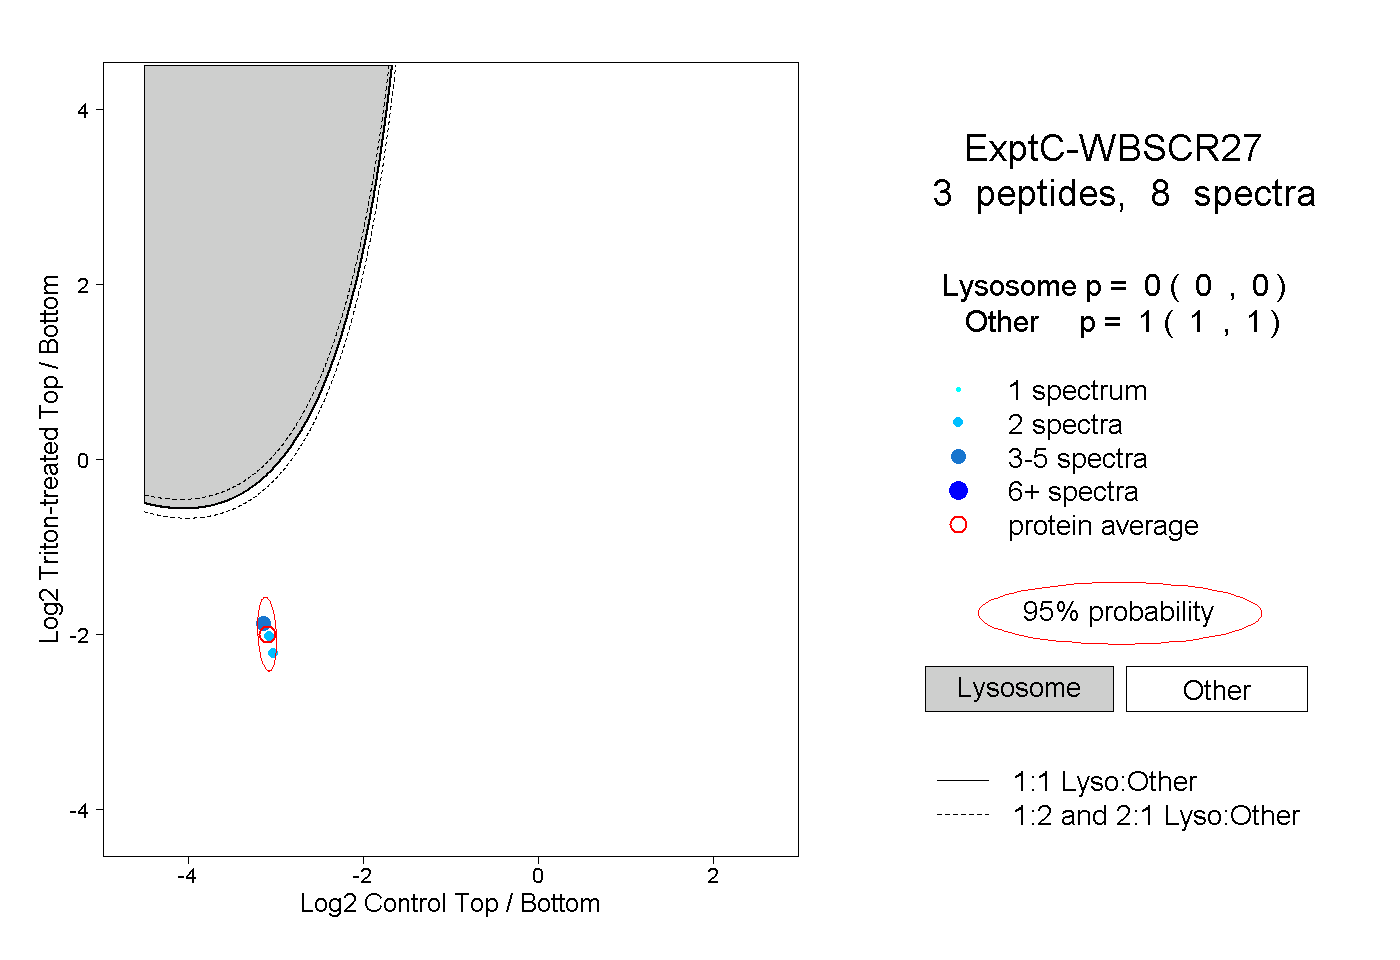
| | | Plot |
|
Lyso |
|
|
|
|
|
|
|
Other |
| Expt C |
3
peptides |
8
spectra |
 |
|
0.000
0.000 | 0.000 |
|
|
|
|
|
|
|
1.000
1.000 | 1.000 |