 9
9peptides
spectra
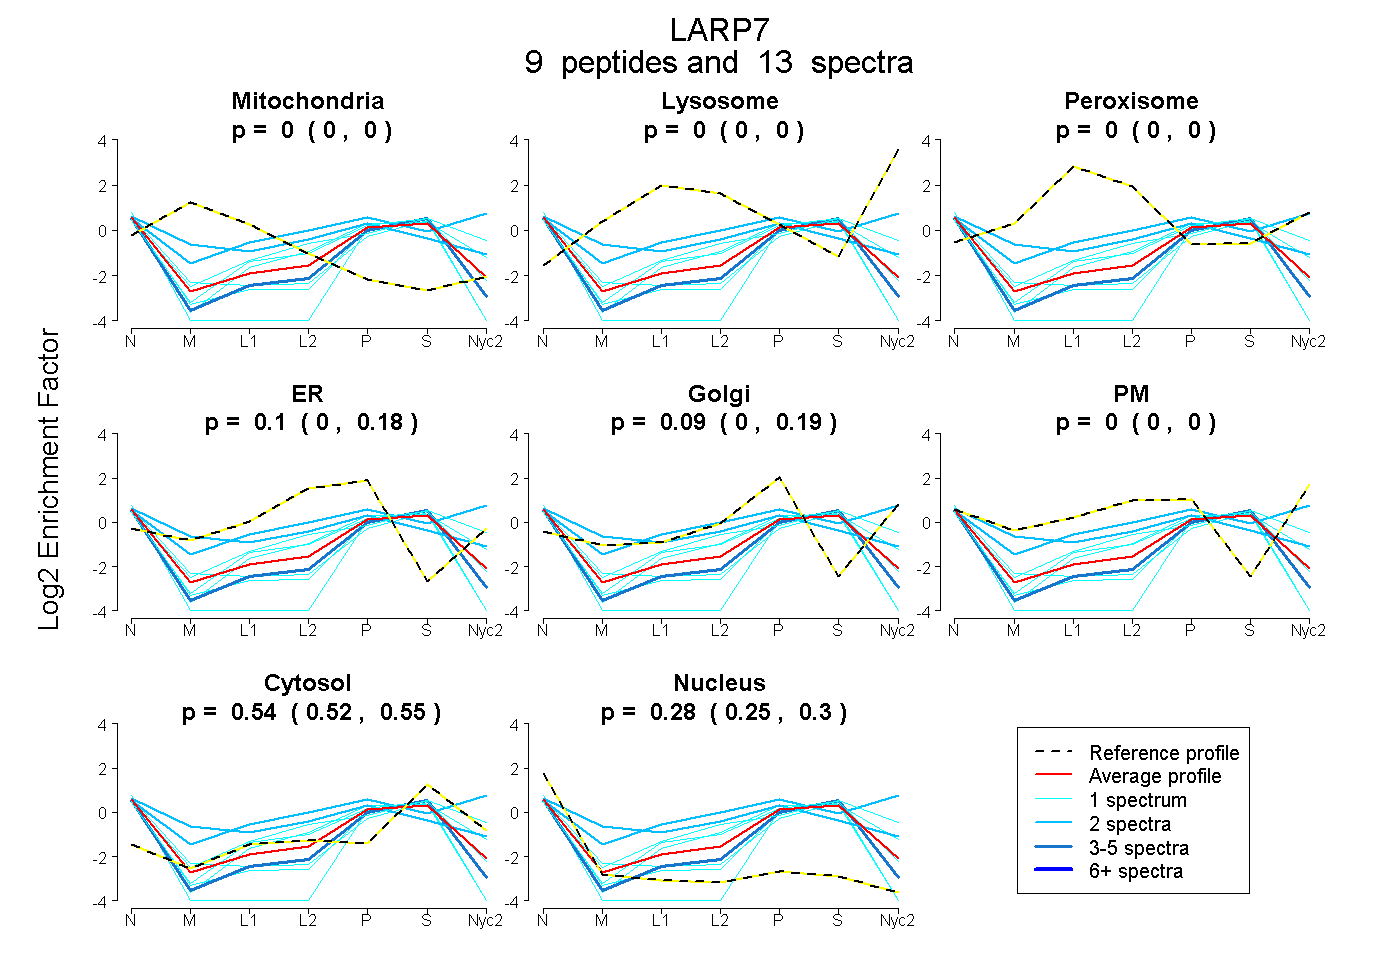
0.000 | 0.000
0.000 | 0.000
0.000 | 0.000
0.000 | 0.176
0.000 | 0.188
0.000 | 0.000
0.520 | 0.547
0.253 | 0.304
| Plot | Mito | Lyso | Perox | ER | Golgi | PM | Cytosol | Nucleus | |||||
| Expt A |
9 peptides |
13 spectra |
|
0.000 0.000 | 0.000 |
0.000 0.000 | 0.000 |
0.000 0.000 | 0.000 |
0.097 0.000 | 0.176 |
0.086 0.000 | 0.188 |
0.000 0.000 | 0.000 |
0.535 0.520 | 0.547 |
0.282 0.253 | 0.304 |
| 1 spectrum, LESEMETESK | 0.000 | 0.000 | 0.000 | 0.000 | 0.000 | 0.000 | 0.508 | 0.492 | ||
| 1 spectrum, GFAFVEFETK | 0.000 | 0.000 | 0.000 | 0.000 | 0.000 | 0.000 | 0.364 | 0.636 | ||
| 1 spectrum, KPGIFPK | 0.000 | 0.000 | 0.000 | 0.081 | 0.163 | 0.000 | 0.580 | 0.176 | ||
| 1 spectrum, TQQASQHIR | 0.000 | 0.000 | 0.000 | 0.194 | 0.000 | 0.000 | 0.587 | 0.219 | ||
| 1 spectrum, TMEESTEK | 0.000 | 0.000 | 0.000 | 0.014 | 0.010 | 0.264 | 0.626 | 0.086 | ||
| 3 spectra, MGEEVIPLR | 0.000 | 0.000 | 0.000 | 0.000 | 0.019 | 0.000 | 0.594 | 0.387 | ||
| 2 spectra, QVLADIAK | 0.000 | 0.000 | 0.000 | 0.000 | 0.000 | 0.571 | 0.429 | 0.000 | ||
| 1 spectrum, AIEFLNNPPEEAPR | 0.000 | 0.000 | 0.000 | 0.012 | 0.000 | 0.000 | 0.505 | 0.483 | ||
| 2 spectra, NVTHSWIER | 0.106 | 0.000 | 0.000 | 0.265 | 0.000 | 0.173 | 0.353 | 0.104 |
| Plot | Mito | Lyso or Perox | ER | Golgi | PM | Cytosol | Nucleus | ||||||
| Expt B |
1 peptide |
1 spectrum |
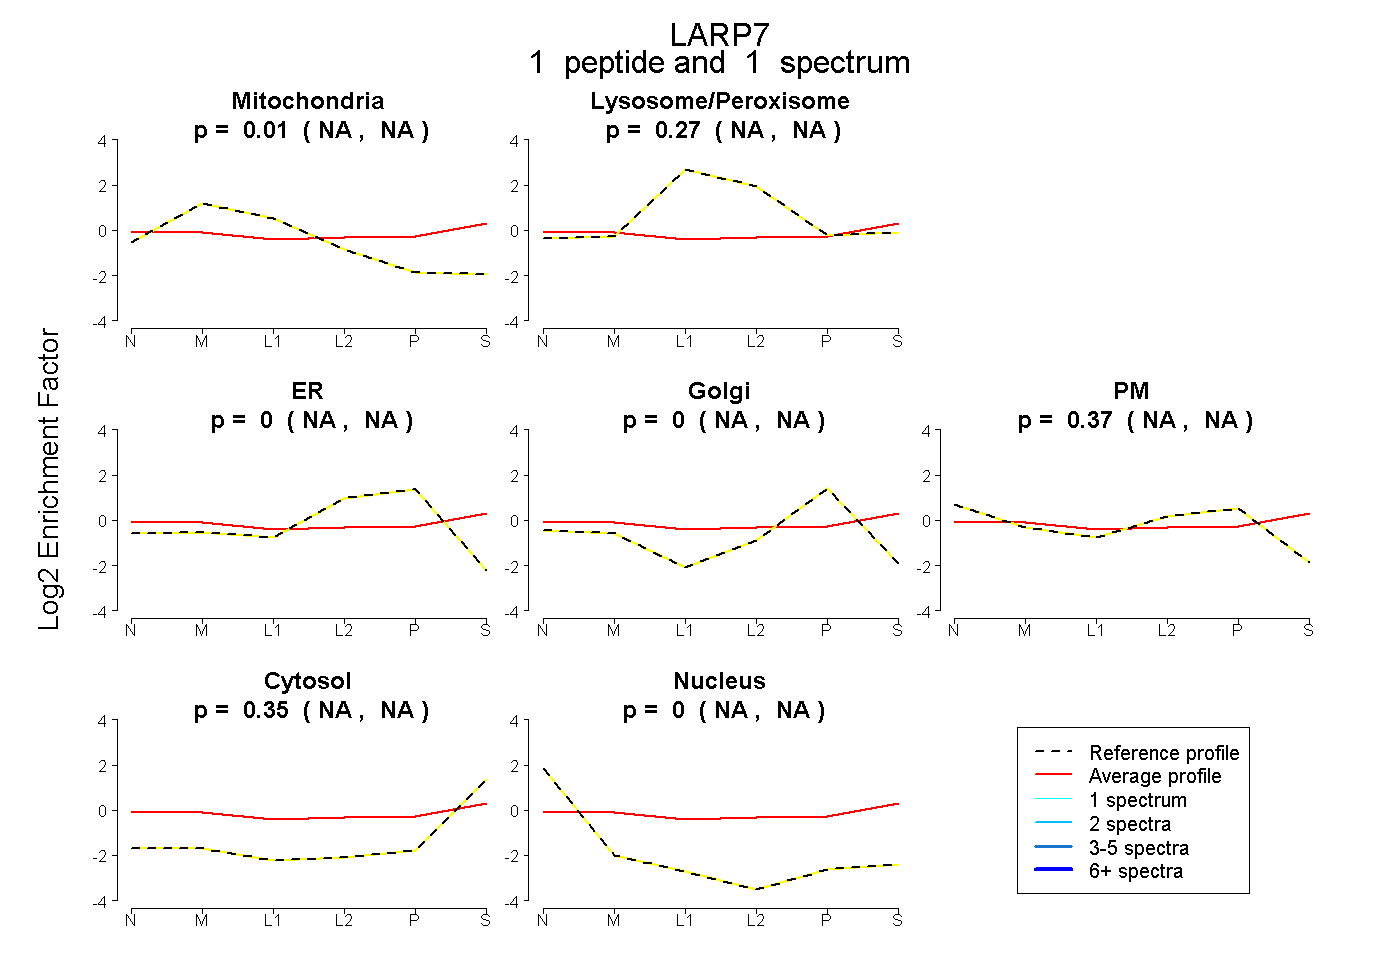 |
0.015 NA | NA |
0.267 NA | NA |
0.000 NA | NA |
0.000 NA | NA |
0.373 NA | NA |
0.345 NA | NA |
0.000 NA | NA |
|||
| Plot | Lyso | Other | |||||||||||
| Expt C |
1 peptide |
1 spectrum |
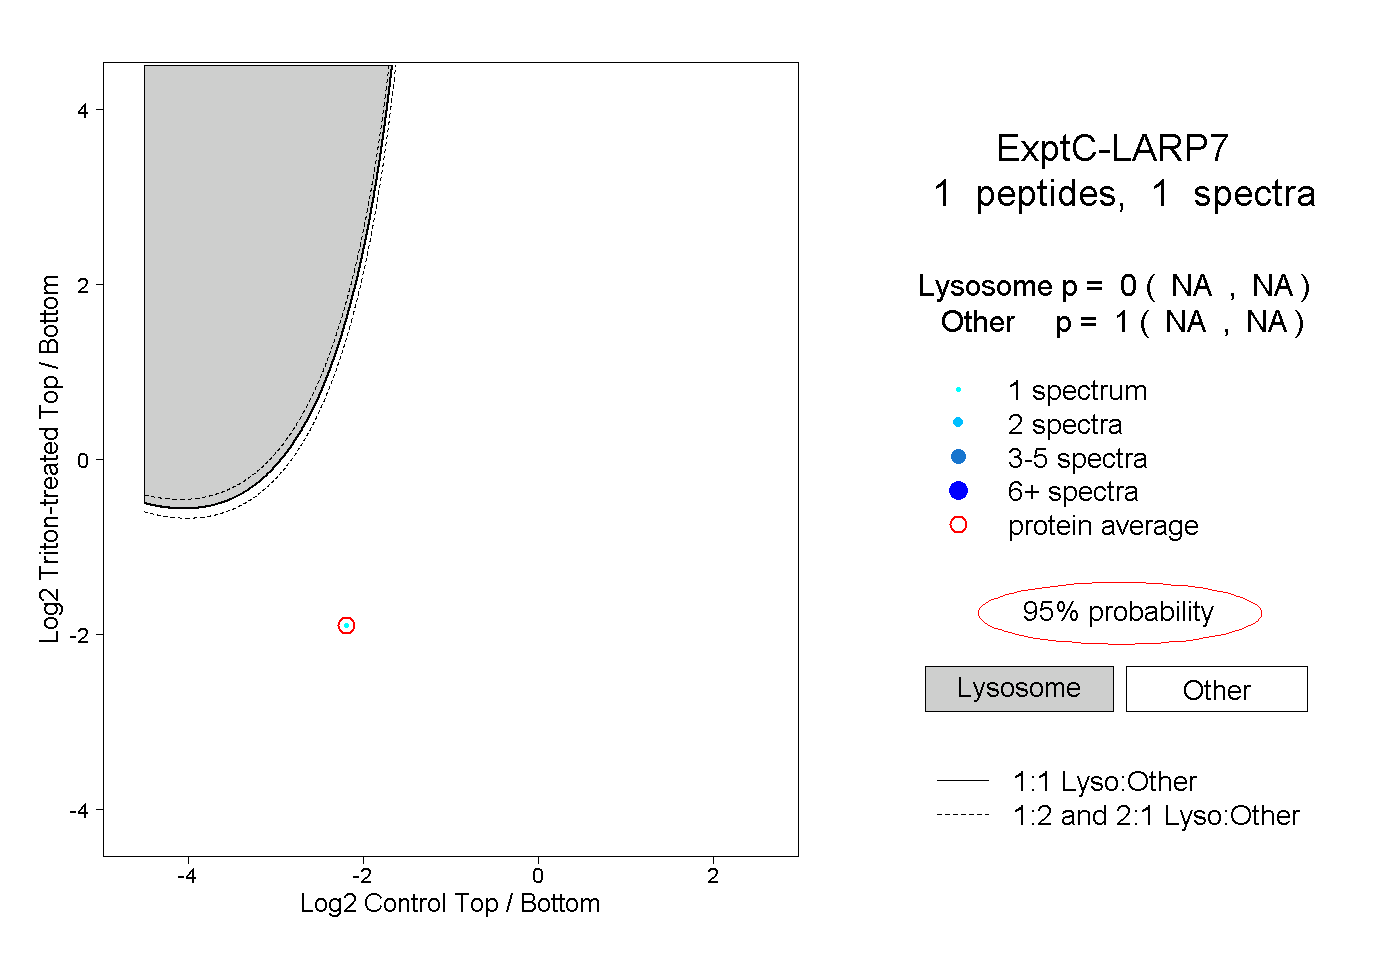 |
0.000 NA | NA |
1.000 NA | NA |