 5
5peptides
spectra
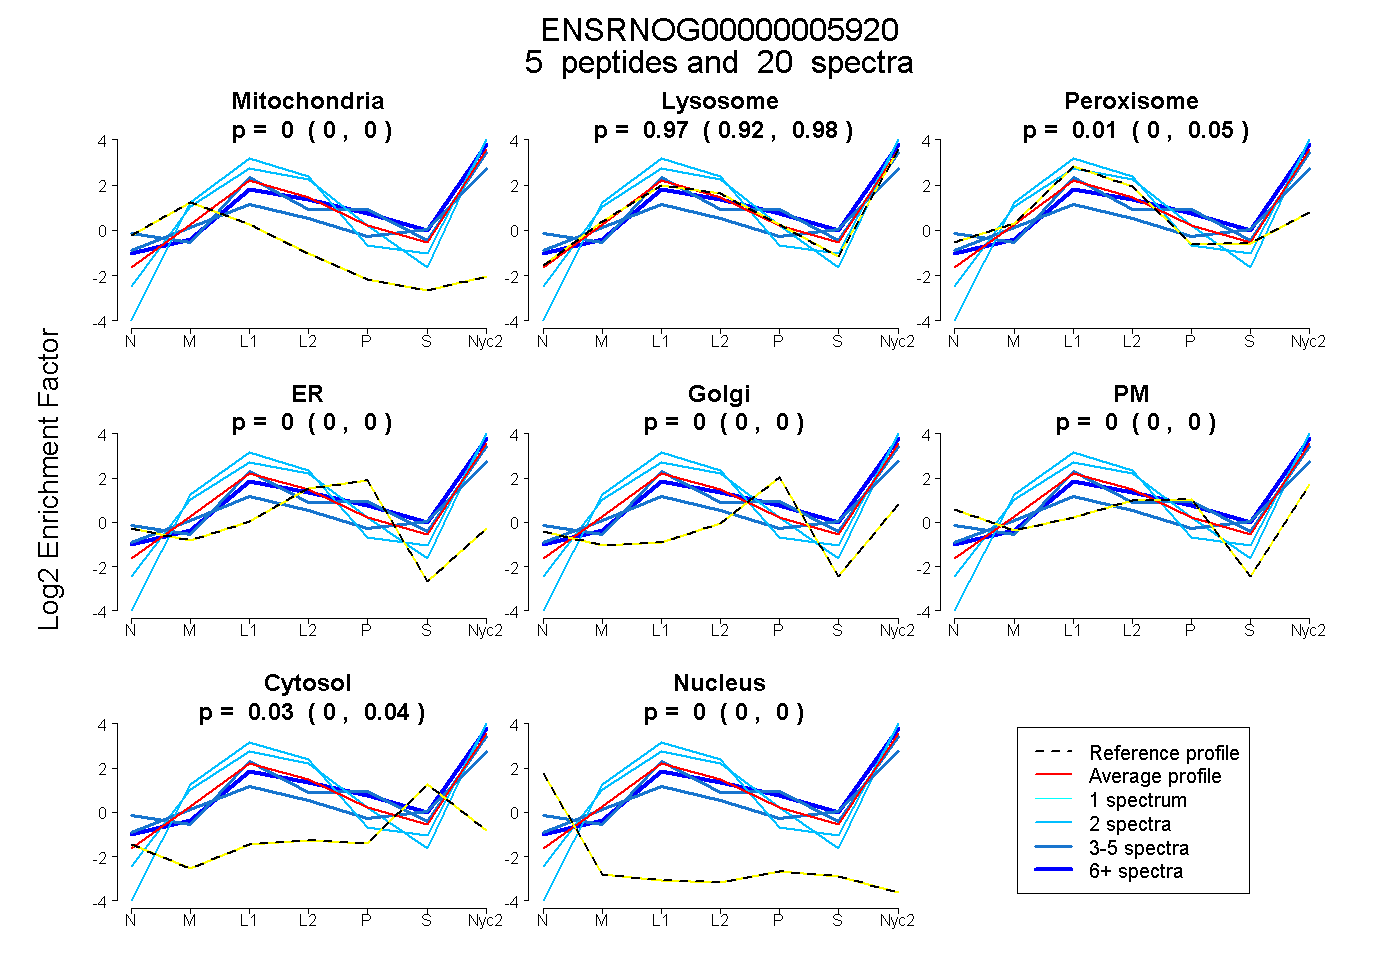
0.000 | 0.000
0.924 | 0.983
0.000 | 0.052
0.000 | 0.000
0.000 | 0.000
0.000 | 0.000
0.002 | 0.041
0.000 | 0.000
3peptides
spectra
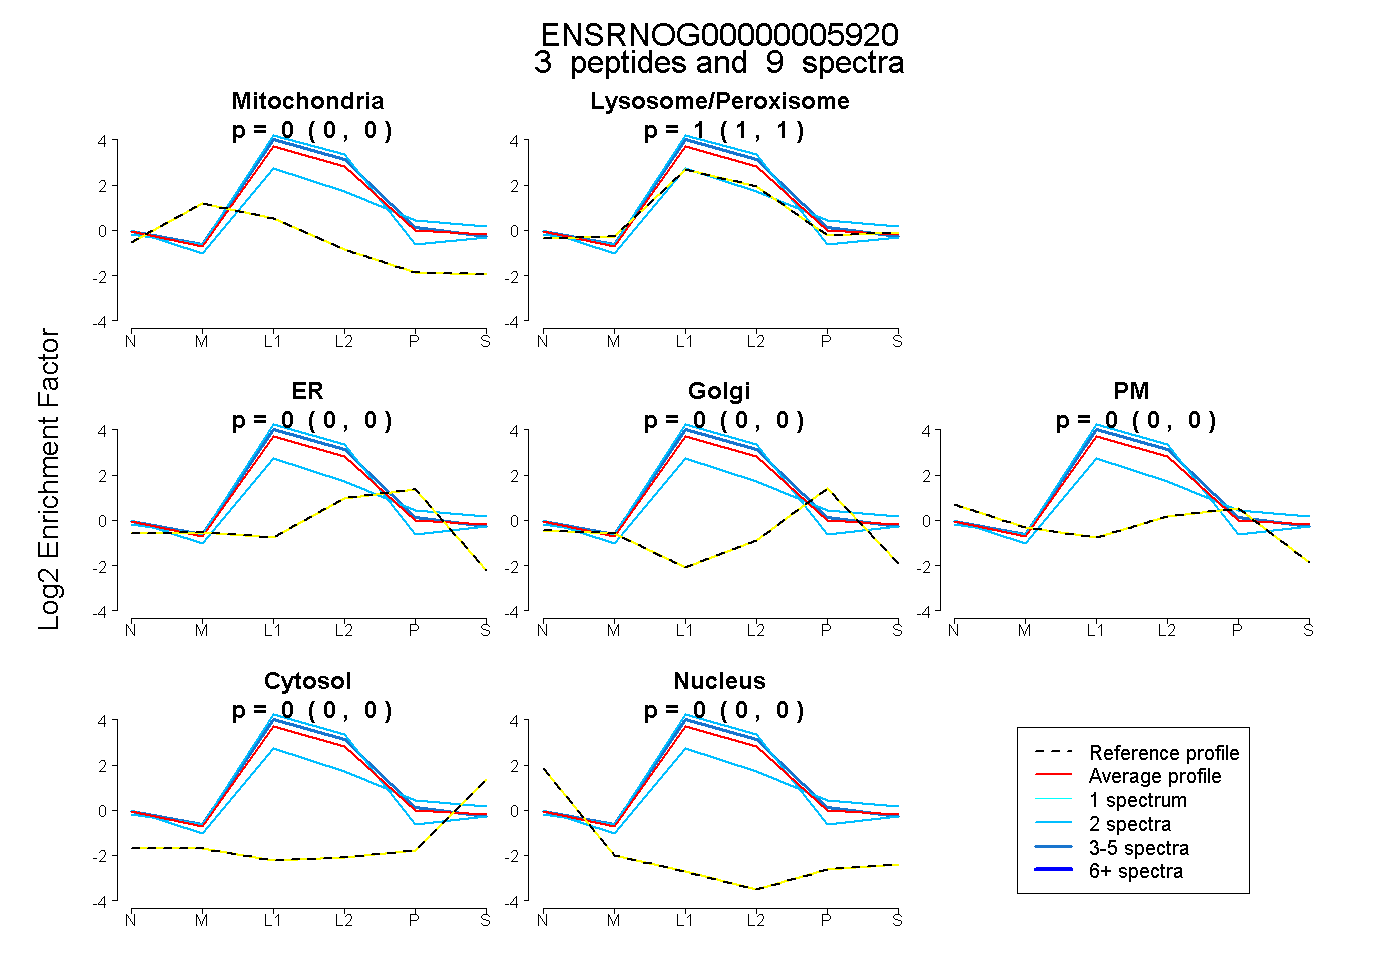
0.000 | 0.000
1.000 | 1.000
0.000 | 0.000
0.000 | 0.000
0.000 | 0.000
0.000 | 0.000
0.000 | 0.000
8peptides
spectra
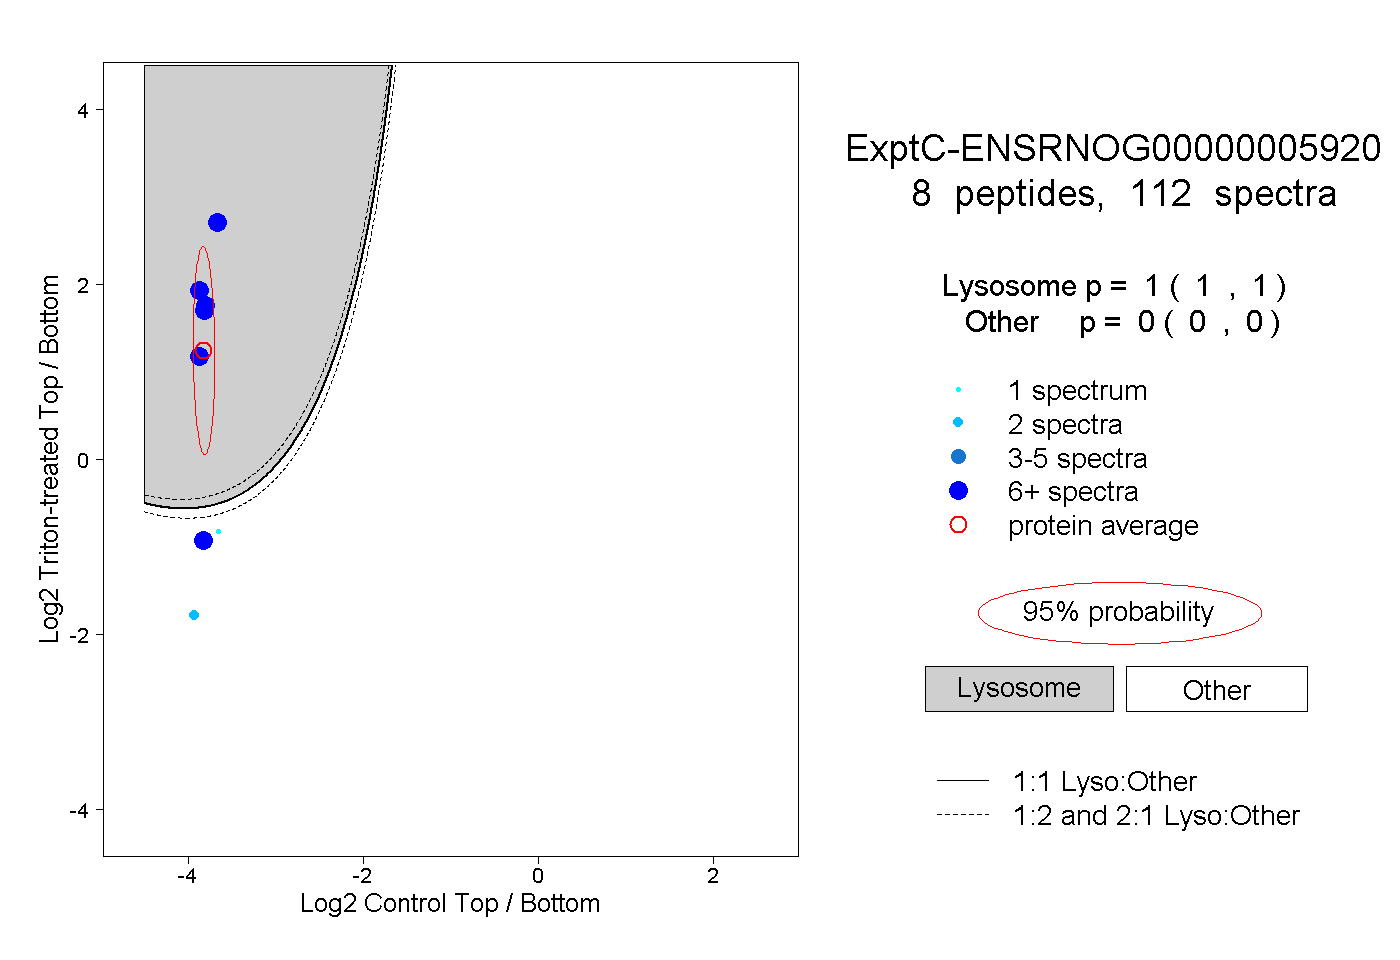
1.000 | 1.000
0.000 | 0.000
2peptides
spectra
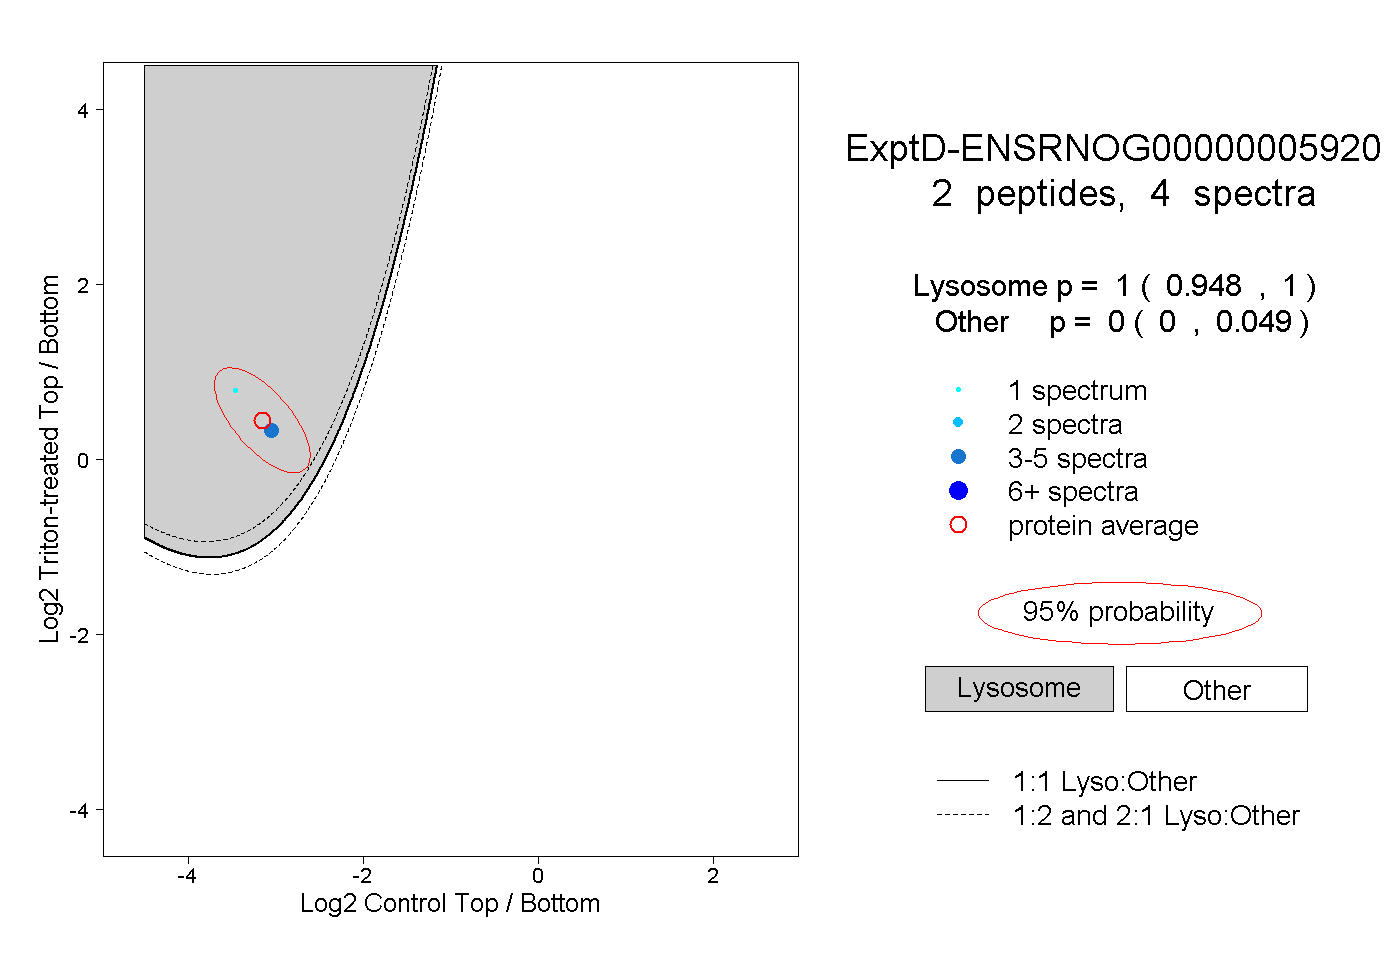
0.948 | 1.000
0.000 | 0.049