 6
6peptides
spectra
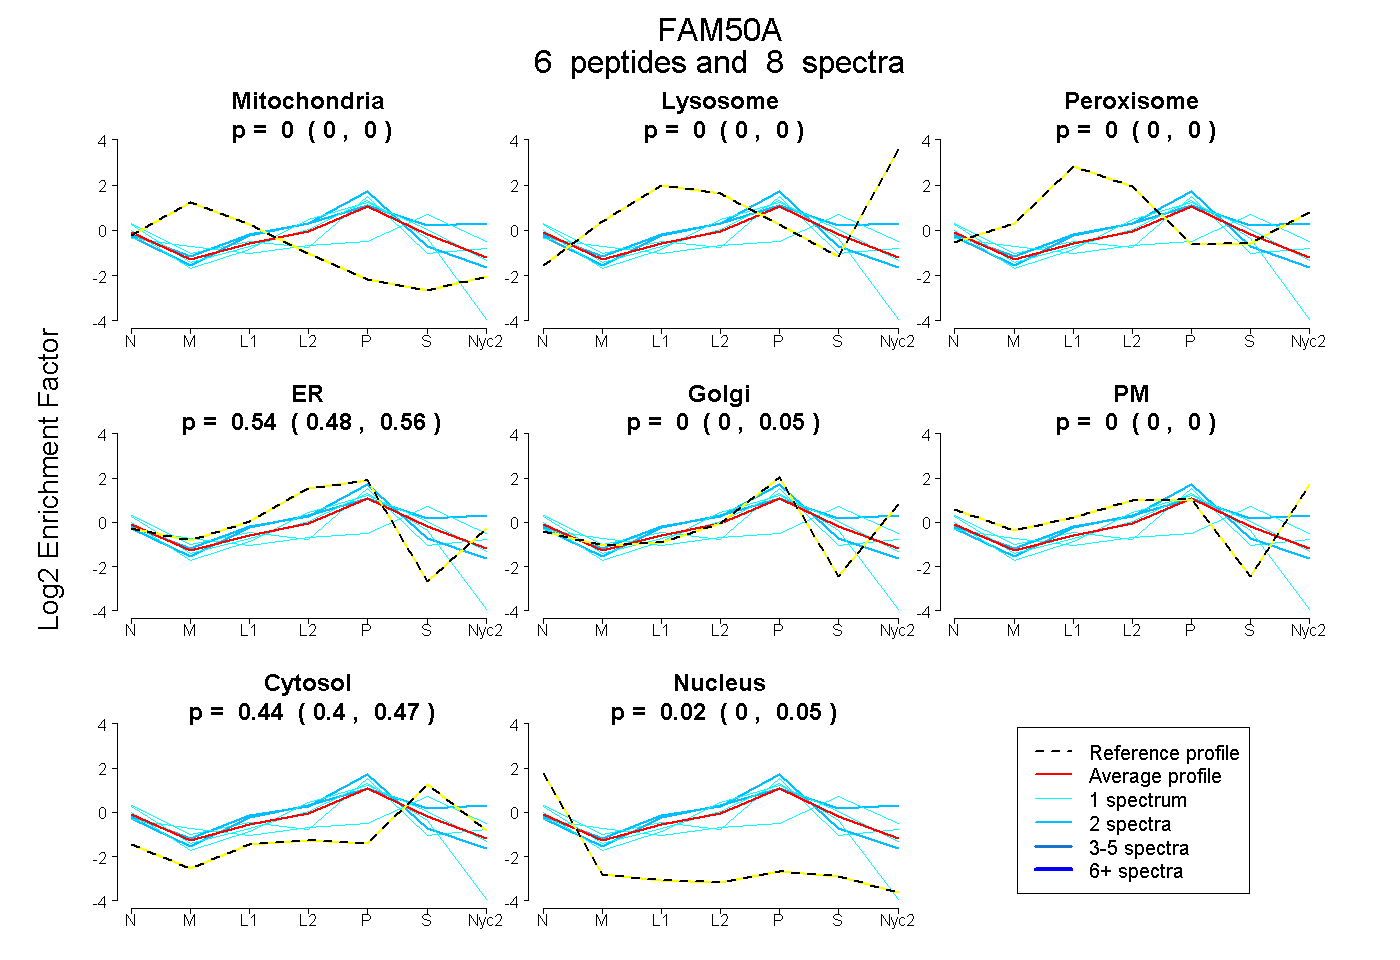
0.000 | 0.000
0.000 | 0.000
0.000 | 0.001
0.478 | 0.555
0.000 | 0.052
0.000 | 0.000
0.404 | 0.470
0.000 | 0.050
| Plot | Mito | Lyso | Perox | ER | Golgi | PM | Cytosol | Nucleus | |||||
| Expt A |
6 peptides |
8 spectra |
|
0.000 0.000 | 0.000 |
0.000 0.000 | 0.000 |
0.000 0.000 | 0.001 |
0.536 0.478 | 0.555 |
0.000 0.000 | 0.052 |
0.000 0.000 | 0.000 |
0.442 0.404 | 0.470 |
0.022 0.000 | 0.050 |
| 2 spectra, GNTMQQFLQK | 0.000 | 0.000 | 0.189 | 0.083 | 0.353 | 0.013 | 0.362 | 0.000 | ||
| 2 spectra, HIFPASR | 0.000 | 0.000 | 0.000 | 0.670 | 0.000 | 0.000 | 0.305 | 0.026 | ||
| 1 spectrum, WEPYDPEK | 0.000 | 0.000 | 0.000 | 0.502 | 0.000 | 0.000 | 0.256 | 0.242 | ||
| 1 spectrum, SGPLFNFDVHDDVR | 0.000 | 0.000 | 0.000 | 0.537 | 0.000 | 0.000 | 0.461 | 0.002 | ||
| 1 spectrum, SAGVEQLMYIK | 0.112 | 0.000 | 0.041 | 0.000 | 0.000 | 0.215 | 0.632 | 0.000 | ||
| 1 spectrum, GAASEAGR | 0.015 | 0.000 | 0.035 | 0.212 | 0.442 | 0.000 | 0.196 | 0.100 |
| Plot | Lyso | Other | |||||||||||
| Expt C |
1 peptide |
2 spectra |
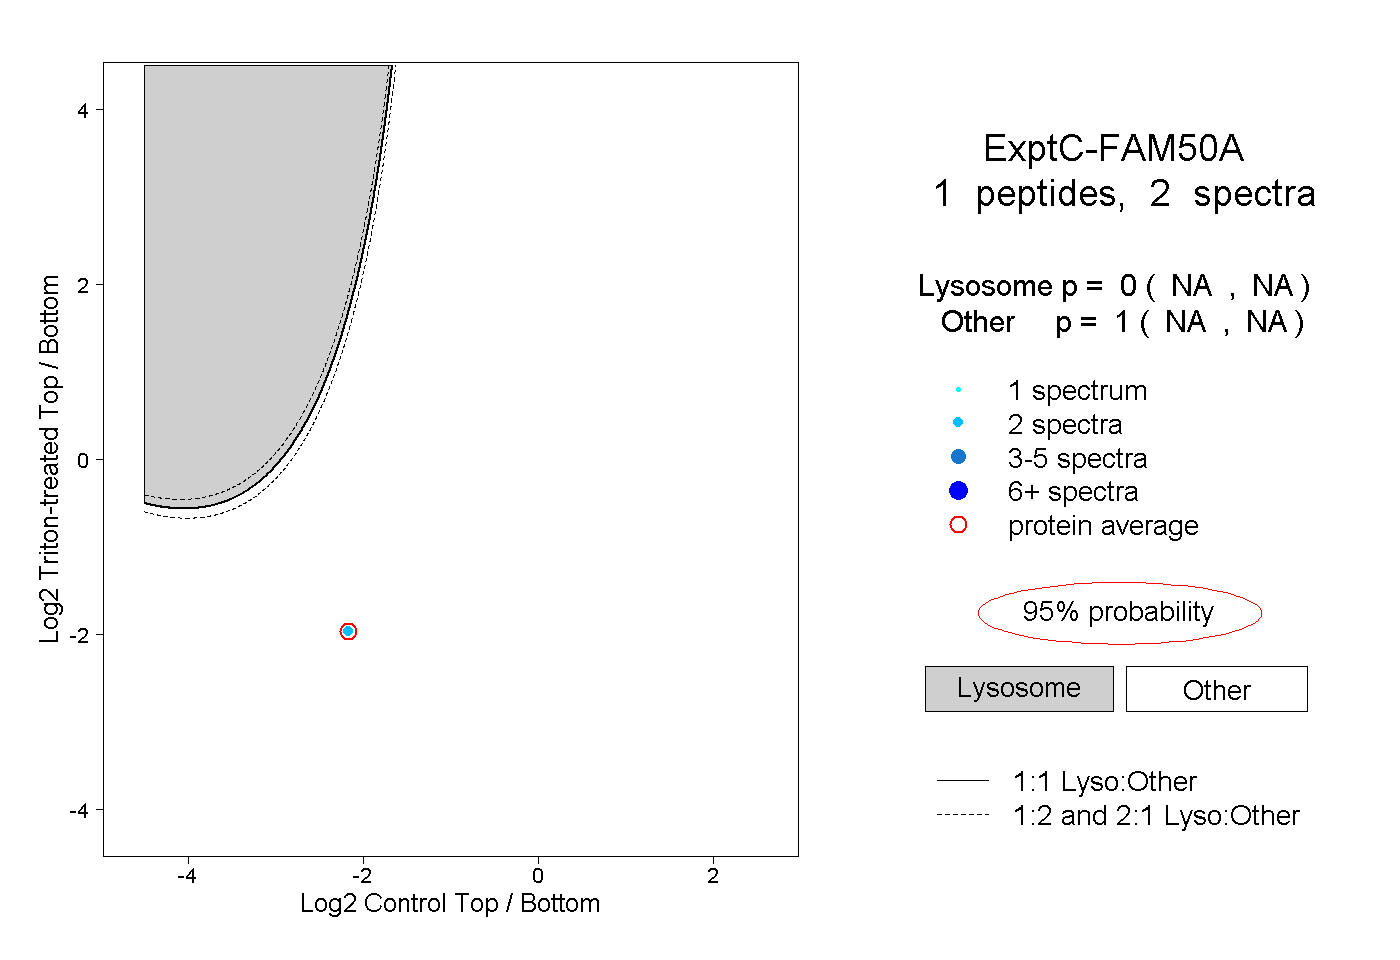 |
0.000 NA | NA |
1.000 NA | NA |