 7
7peptides
spectra
0.000 | 0.000
0.000 | 0.034
0.000 | 0.017
0.000 | 0.000
0.076 | 0.112
0.073 | 0.115
0.779 | 0.796
0.000 | 0.000
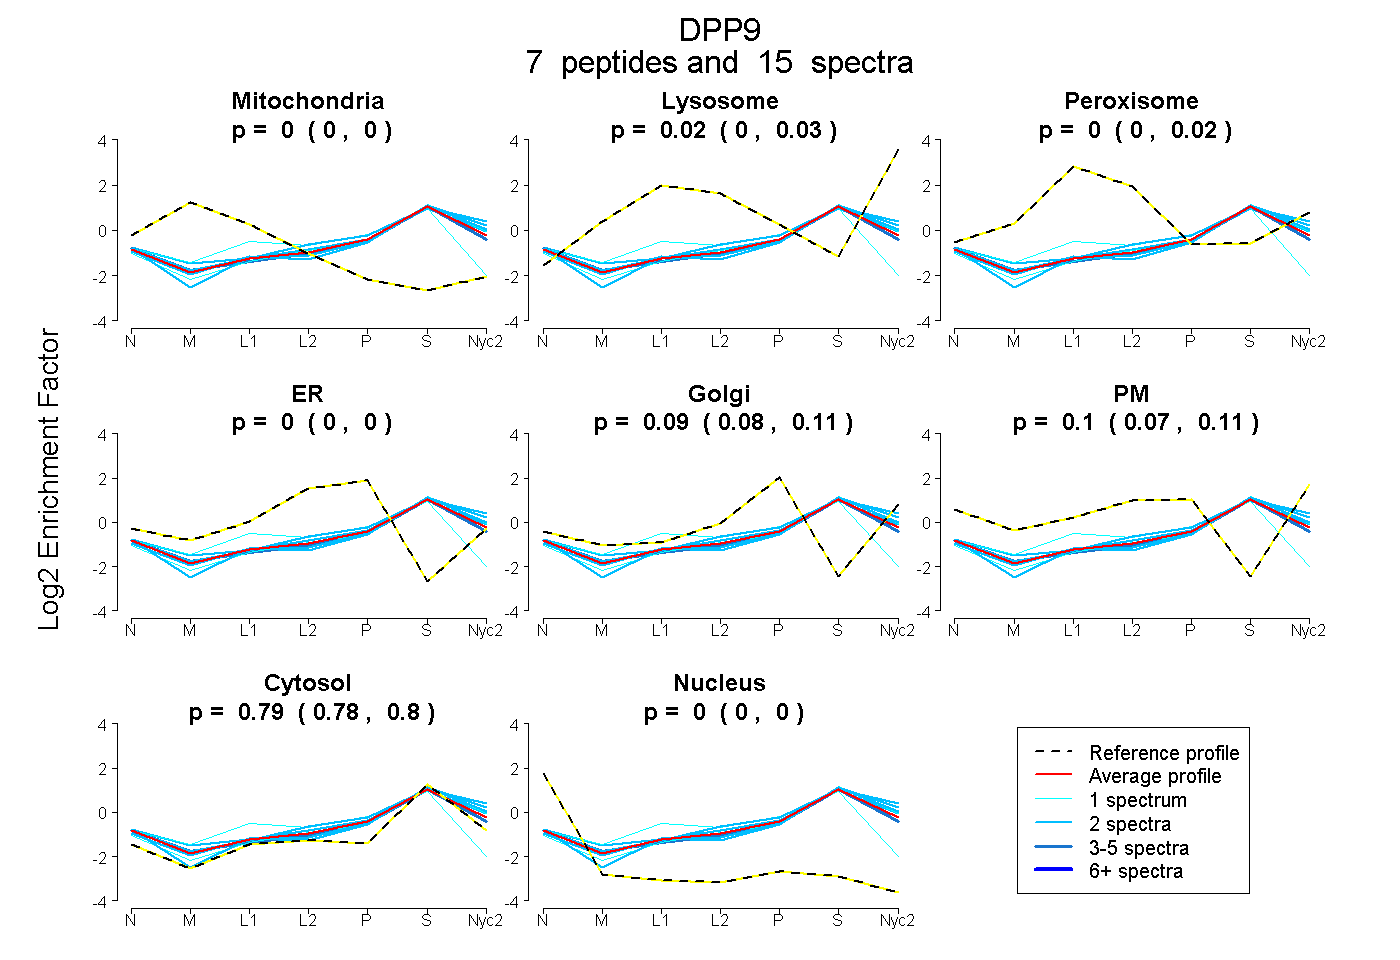
| Plot | Mito | Lyso | Perox | ER | Golgi | PM | Cytosol | Nucleus | |||||
| Expt A |
7 peptides |
15 spectra |
|
0.000 0.000 | 0.000 |
0.019 0.000 | 0.034 |
0.000 0.000 | 0.017 |
0.000 0.000 | 0.000 |
0.091 0.076 | 0.112 |
0.101 0.073 | 0.115 |
0.789 0.779 | 0.796 |
0.000 0.000 | 0.000 |
| 2 spectra, YAWAMFLDRPQQR | 0.000 | 0.108 | 0.000 | 0.000 | 0.105 | 0.076 | 0.712 | 0.000 | ||
| 2 spectra, GLHFEGALK | 0.000 | 0.039 | 0.000 | 0.000 | 0.054 | 0.159 | 0.748 | 0.000 | ||
| 2 spectra, VEYIAR | 0.000 | 0.014 | 0.000 | 0.000 | 0.080 | 0.085 | 0.822 | 0.000 | ||
| 1 spectrum, TGFCHLYR | 0.103 | 0.000 | 0.030 | 0.167 | 0.000 | 0.000 | 0.700 | 0.000 | ||
| 2 spectra, LYYLGMPYGSR | 0.000 | 0.100 | 0.000 | 0.000 | 0.110 | 0.000 | 0.791 | 0.000 | ||
| 1 spectrum, SAGVATFVLQEEFDR | 0.000 | 0.063 | 0.000 | 0.000 | 0.116 | 0.004 | 0.817 | 0.000 | ||
| 5 spectra, LSGPDDDPLHK | 0.000 | 0.000 | 0.000 | 0.000 | 0.089 | 0.104 | 0.807 | 0.000 |
| Plot | Mito | Lyso or Perox | ER | Golgi | PM | Cytosol | Nucleus | ||||||
| Expt B |
2 peptides |
2 spectra |
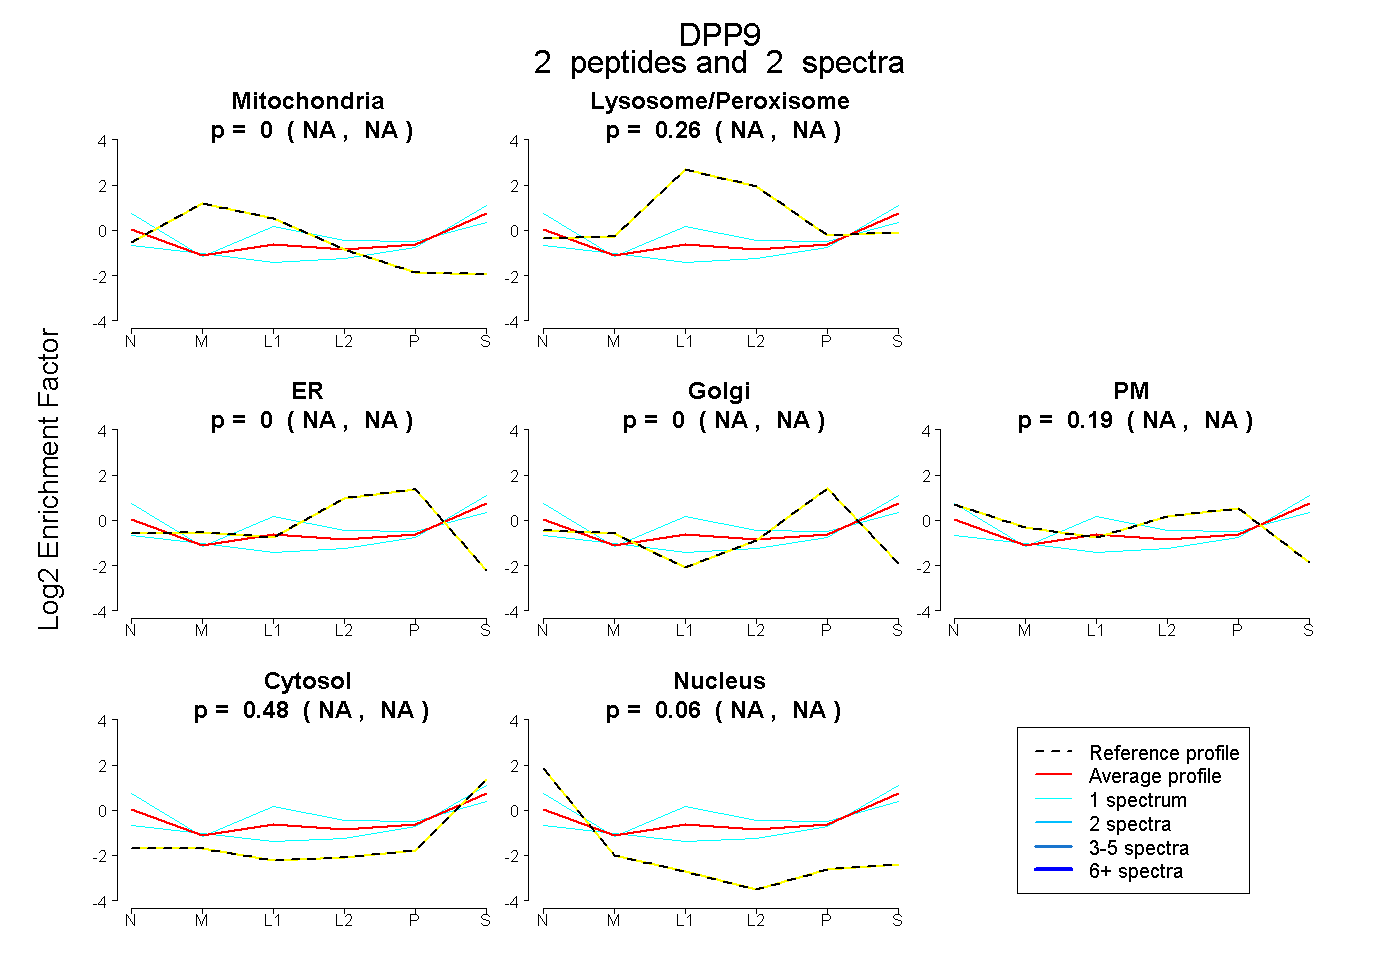 |
0.000 NA | NA |
0.265 NA | NA |
0.000 NA | NA |
0.000 NA | NA |
0.193 NA | NA |
0.477 NA | NA |
0.065 NA | NA |
|||
| Plot | Lyso | Other | |||||||||||
| Expt C |
12 peptides |
26 spectra |
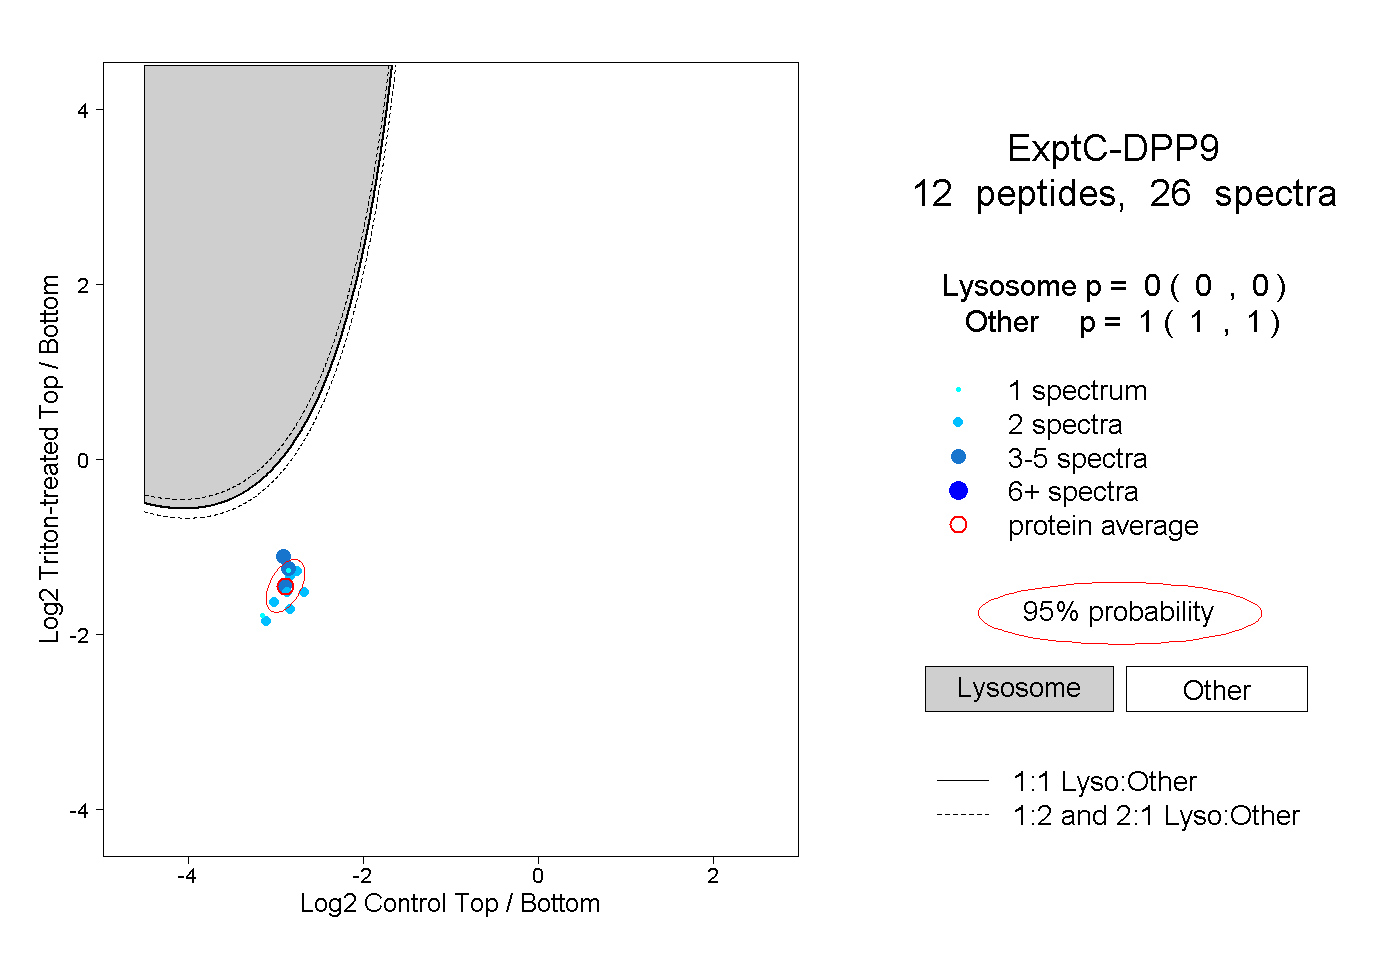 |
0.000 0.000 | 0.000 |
1.000 1.000 | 1.000 |
||||||||
| Plot | Lyso | Other | |||||||||||
| Expt D |
1 peptide |
1 spectrum |
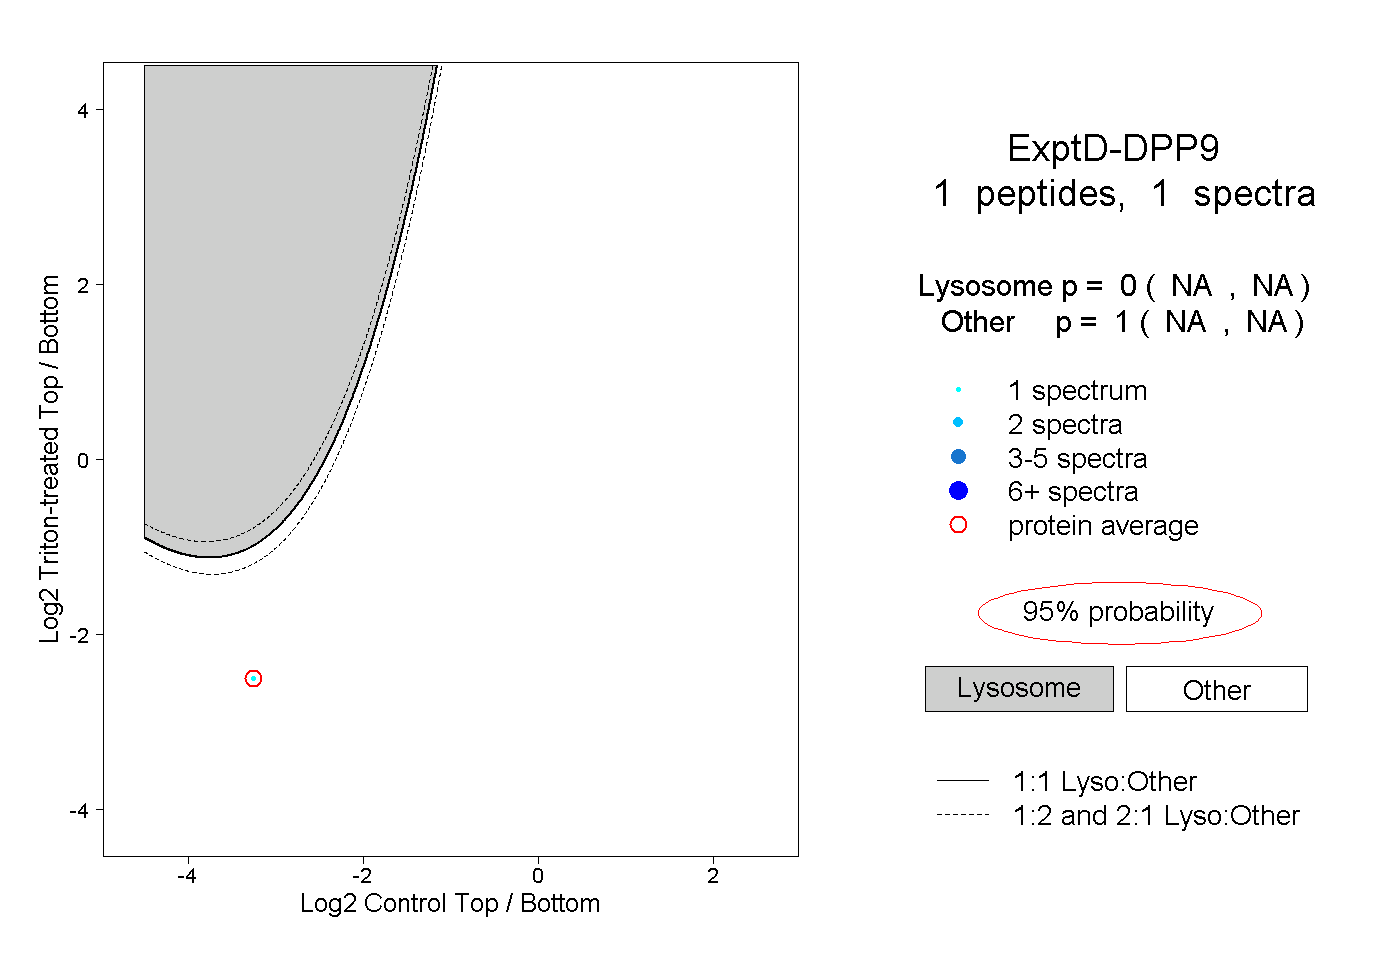 |
0.000 NA | NA |
1.000 NA | NA |