 3
3peptides
spectra
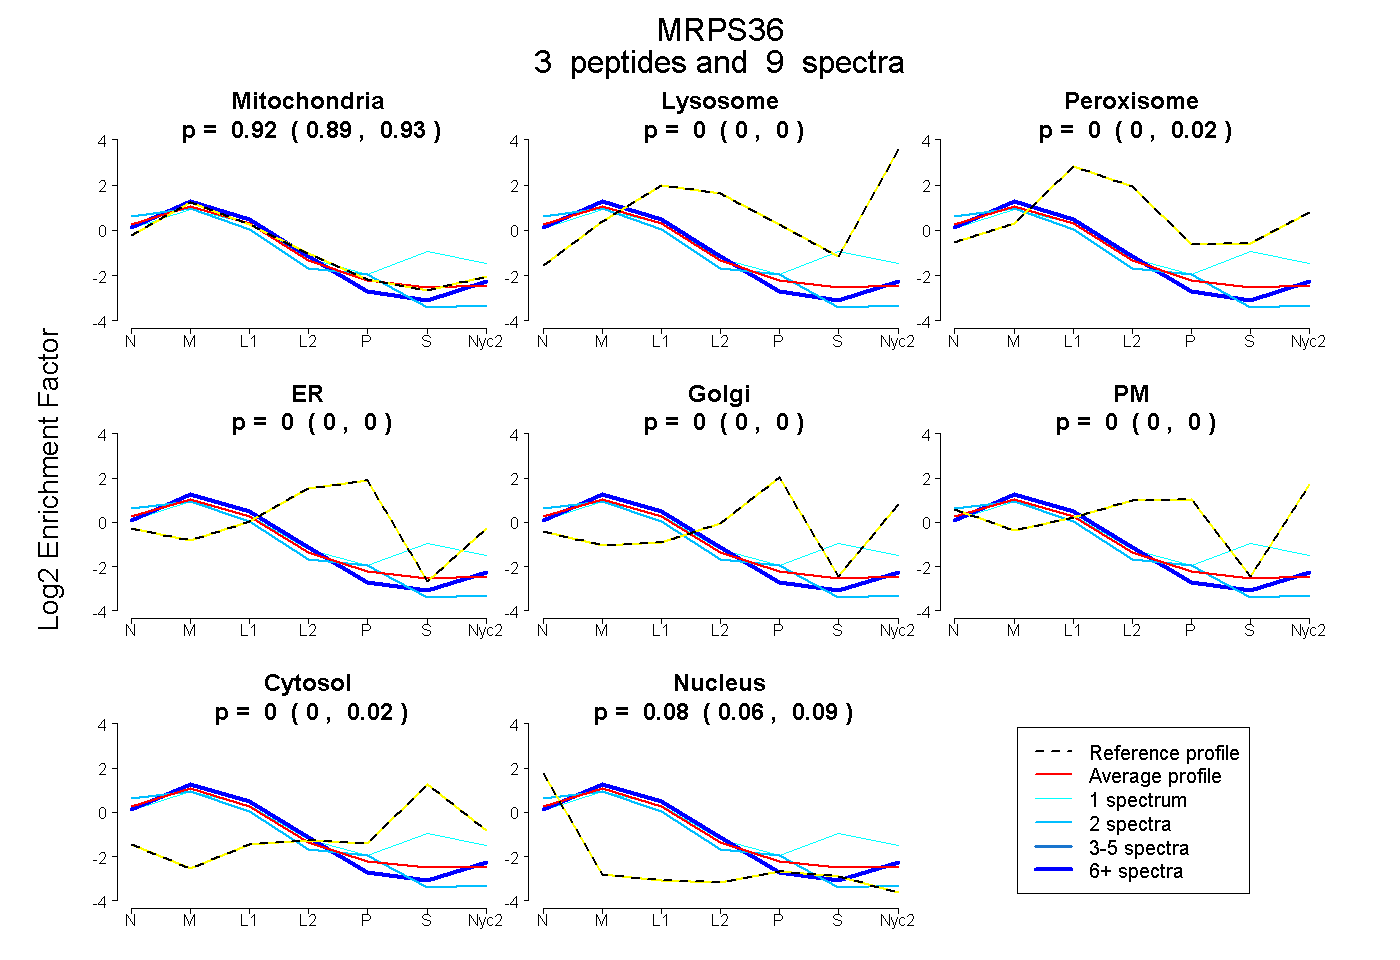
0.886 | 0.934
0.000 | 0.000
0.000 | 0.020
0.000 | 0.000
0.000 | 0.000
0.000 | 0.000
0.000 | 0.019
0.057 | 0.093
1peptide
spectra
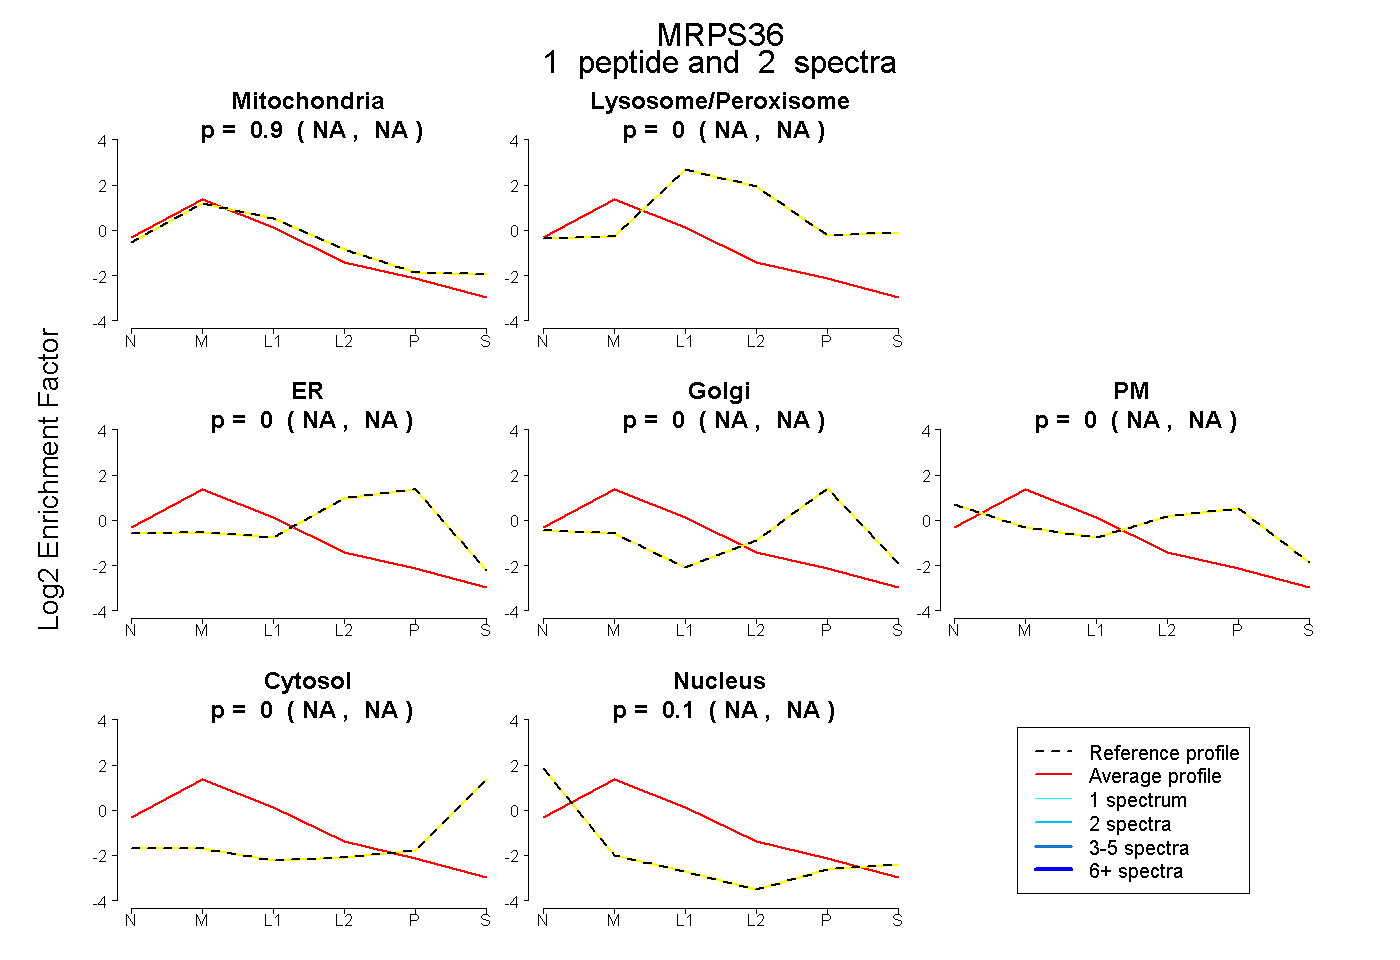
NA | NA
NA | NA
NA | NA
NA | NA
NA | NA
NA | NA
NA | NA
4peptides
spectra
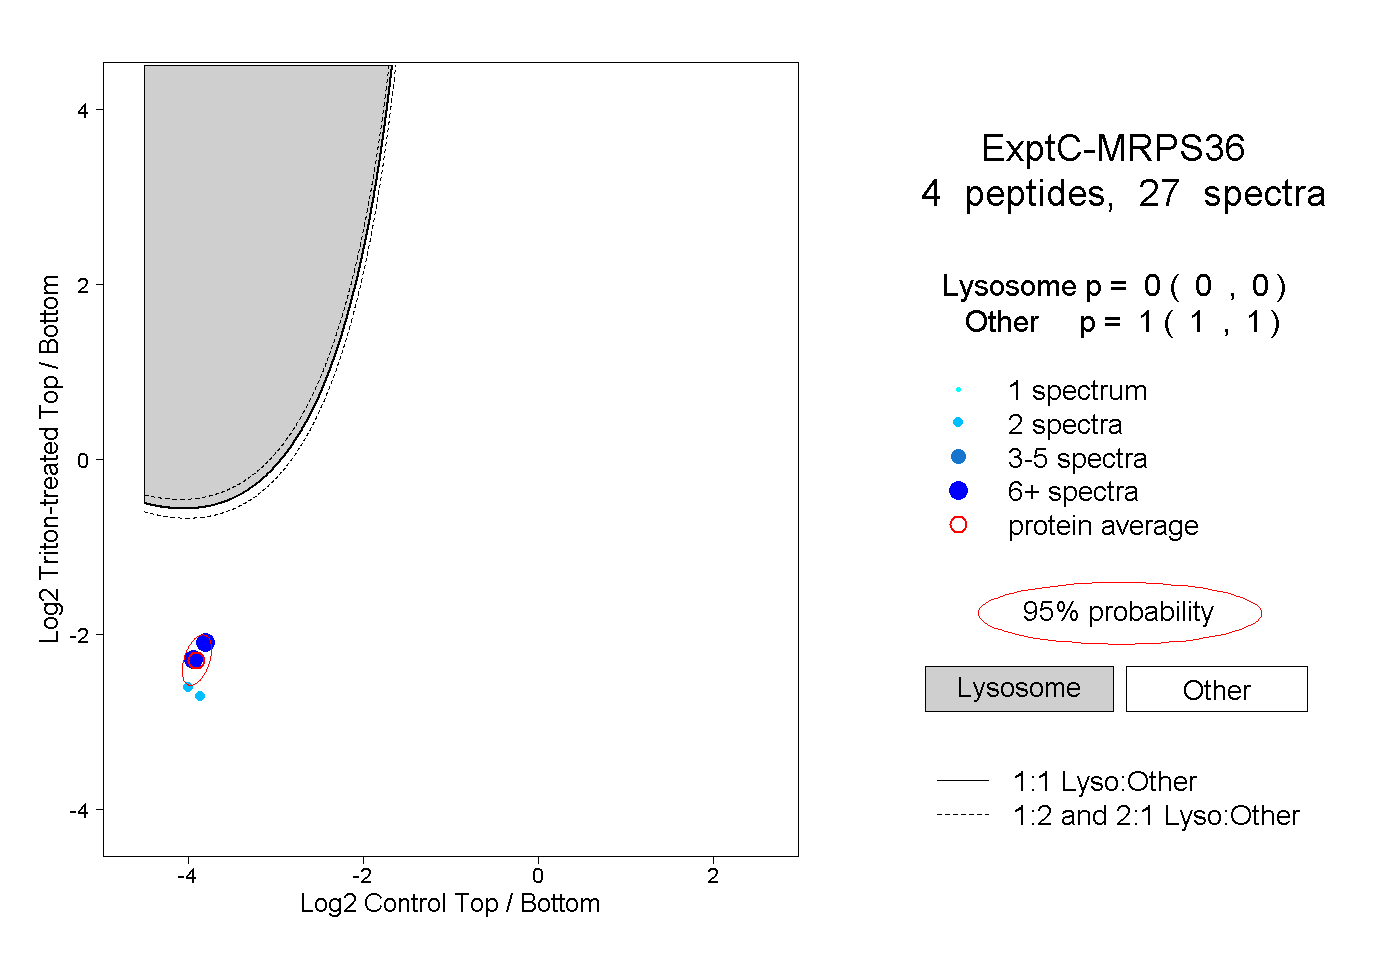
0.000 | 0.000
1.000 | 1.000
1peptide
spectra
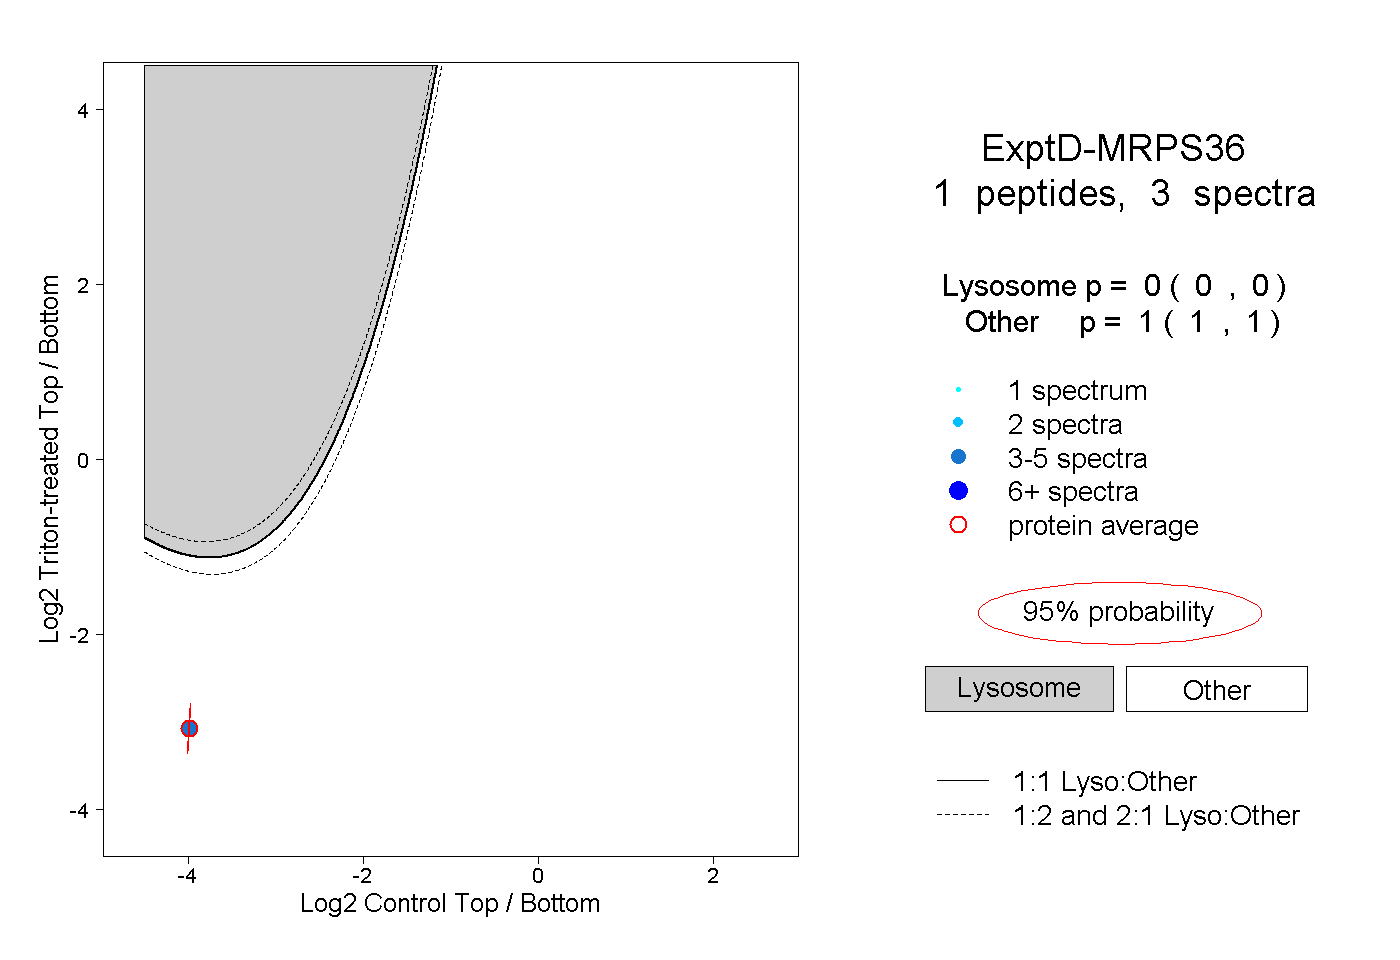
0.000 | 0.000
1.000 | 1.000