 4
4peptides
spectra
0.000 | 0.000
0.034 | 0.097
0.000 | 0.049
0.000 | 0.113
0.446 | 0.618
0.044 | 0.190
0.155 | 0.230
0.000 | 0.000
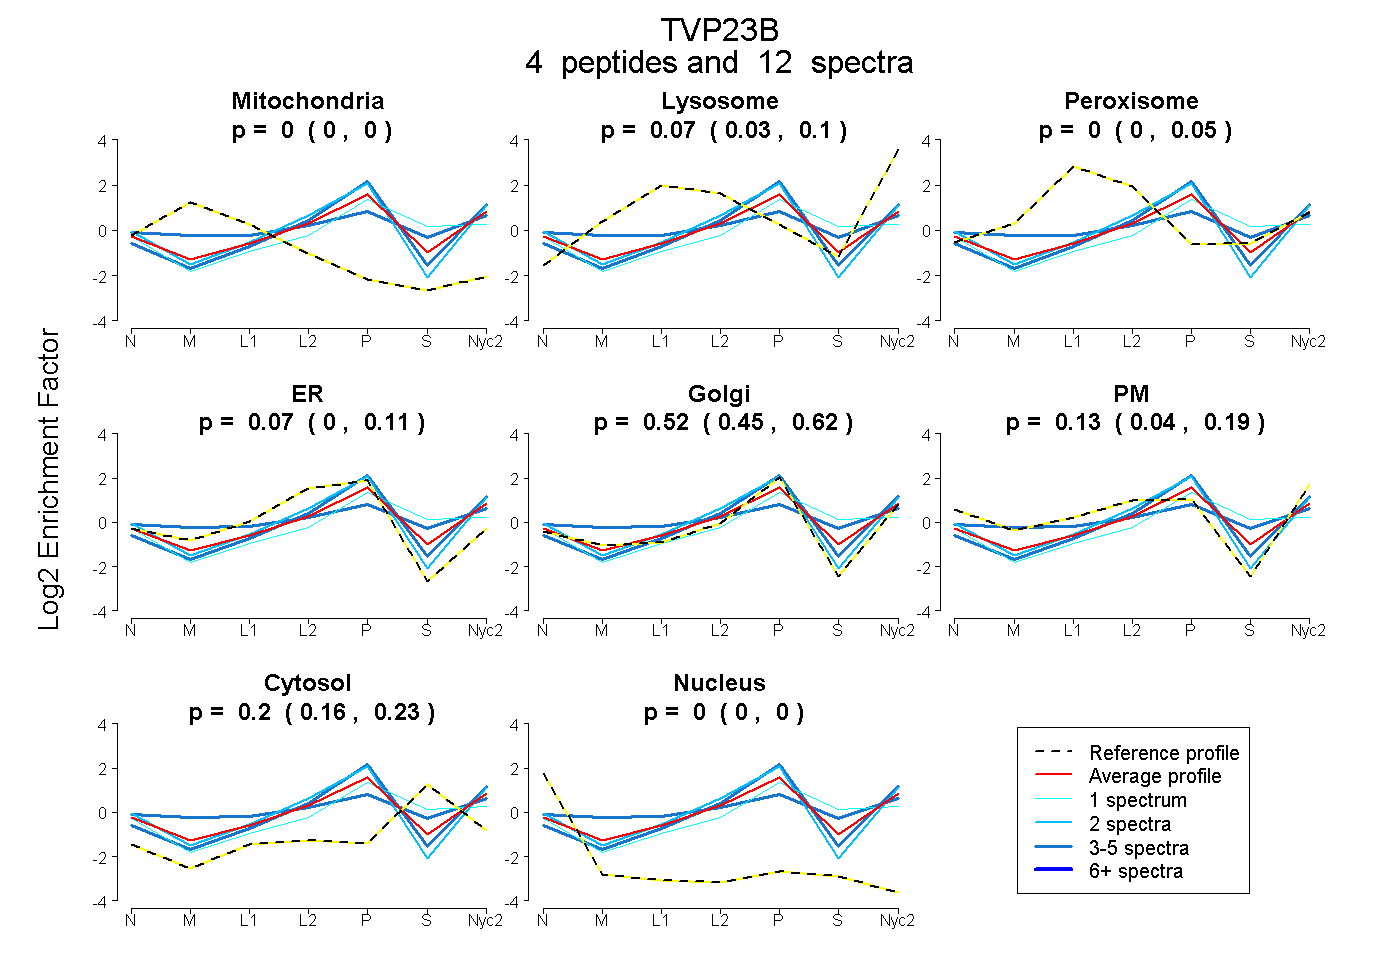
| Plot | Mito | Lyso | Perox | ER | Golgi | PM | Cytosol | Nucleus | |||||
| Expt A |
4 peptides |
12 spectra |
|
0.000 0.000 | 0.000 |
0.073 0.034 | 0.097 |
0.000 0.000 | 0.049 |
0.074 0.000 | 0.113 |
0.523 0.446 | 0.618 |
0.130 0.044 | 0.190 |
0.200 0.155 | 0.230 |
0.000 0.000 | 0.000 |
| 1 spectrum, STPQDSK | 0.000 | 0.000 | 0.024 | 0.011 | 0.534 | 0.012 | 0.419 | 0.000 | ||
| 4 spectra, LMVGLR | 0.000 | 0.088 | 0.000 | 0.016 | 0.818 | 0.000 | 0.078 | 0.000 | ||
| 2 spectra, TISEAESR | 0.000 | 0.008 | 0.000 | 0.120 | 0.653 | 0.204 | 0.016 | 0.000 | ||
| 5 spectra, SHWVFESR | 0.000 | 0.007 | 0.212 | 0.000 | 0.275 | 0.248 | 0.257 | 0.000 |
| Plot | Mito | Lyso or Perox | ER | Golgi | PM | Cytosol | Nucleus | ||||||
| Expt B |
1 peptide |
1 spectrum |
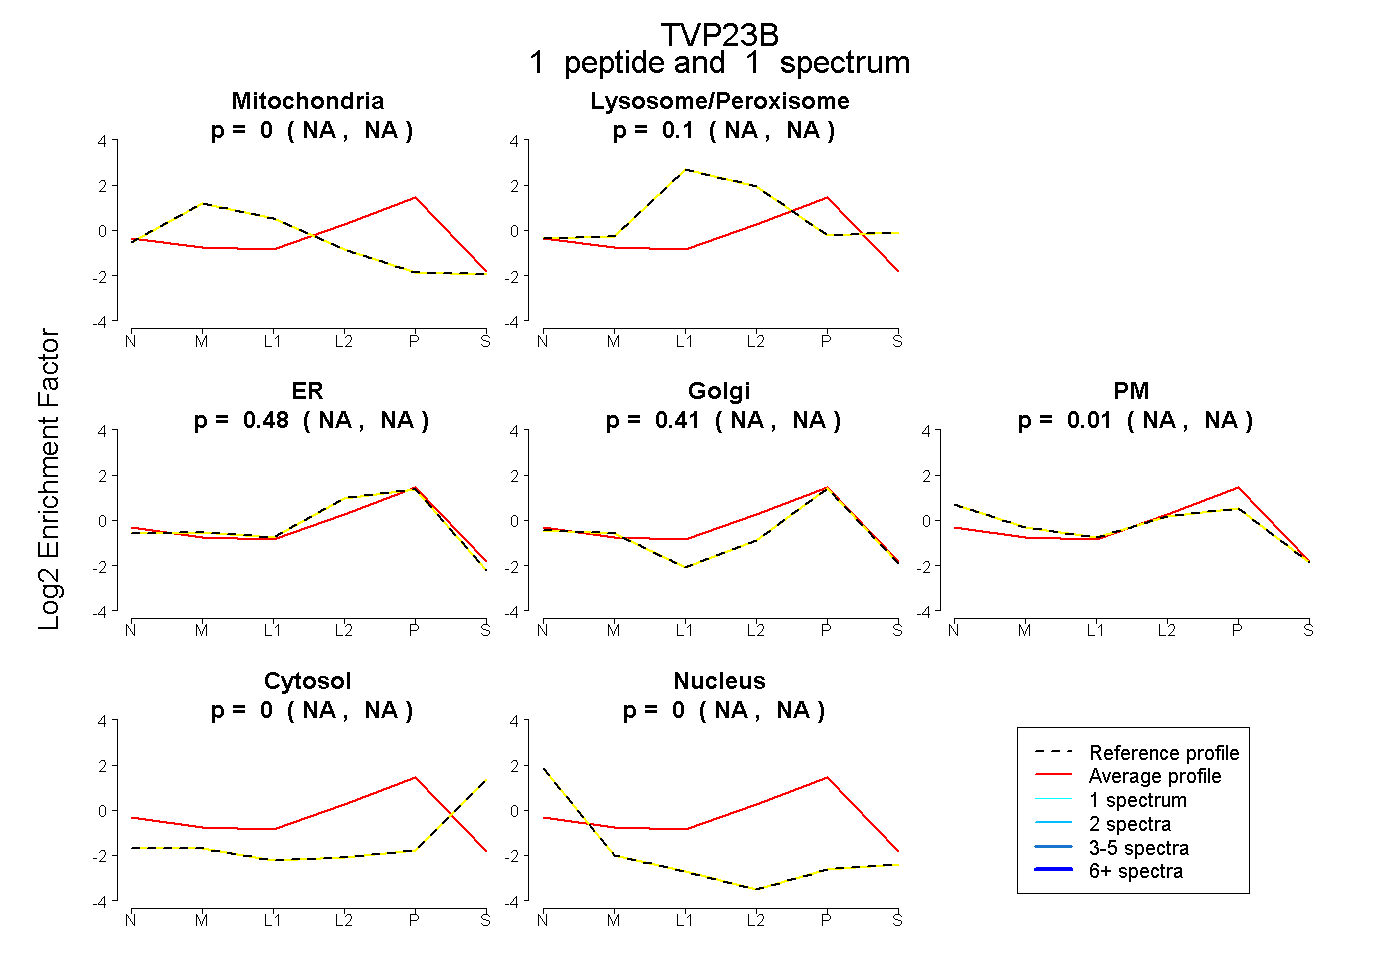 |
0.000 NA | NA |
0.101 NA | NA |
0.483 NA | NA |
0.410 NA | NA |
0.006 NA | NA |
0.000 NA | NA |
0.000 NA | NA |
|||
| Plot | Lyso | Other | |||||||||||
| Expt C |
3 peptides |
7 spectra |
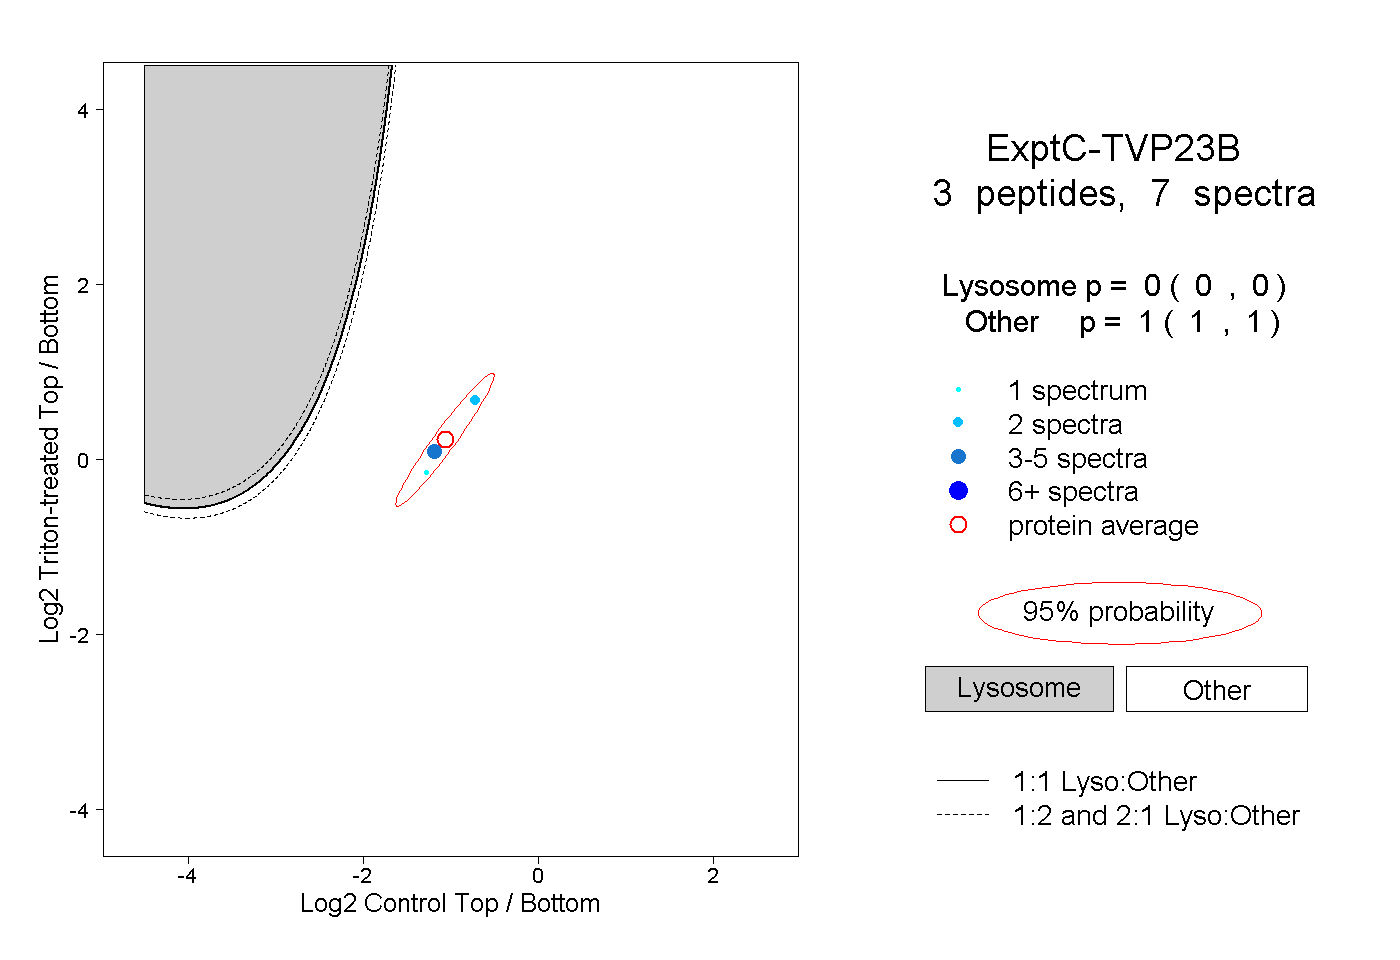 |
0.000 0.000 | 0.000 |
1.000 1.000 | 1.000 |
||||||||
| Plot | Lyso | Other | |||||||||||
| Expt D |
1 peptide |
1 spectrum |
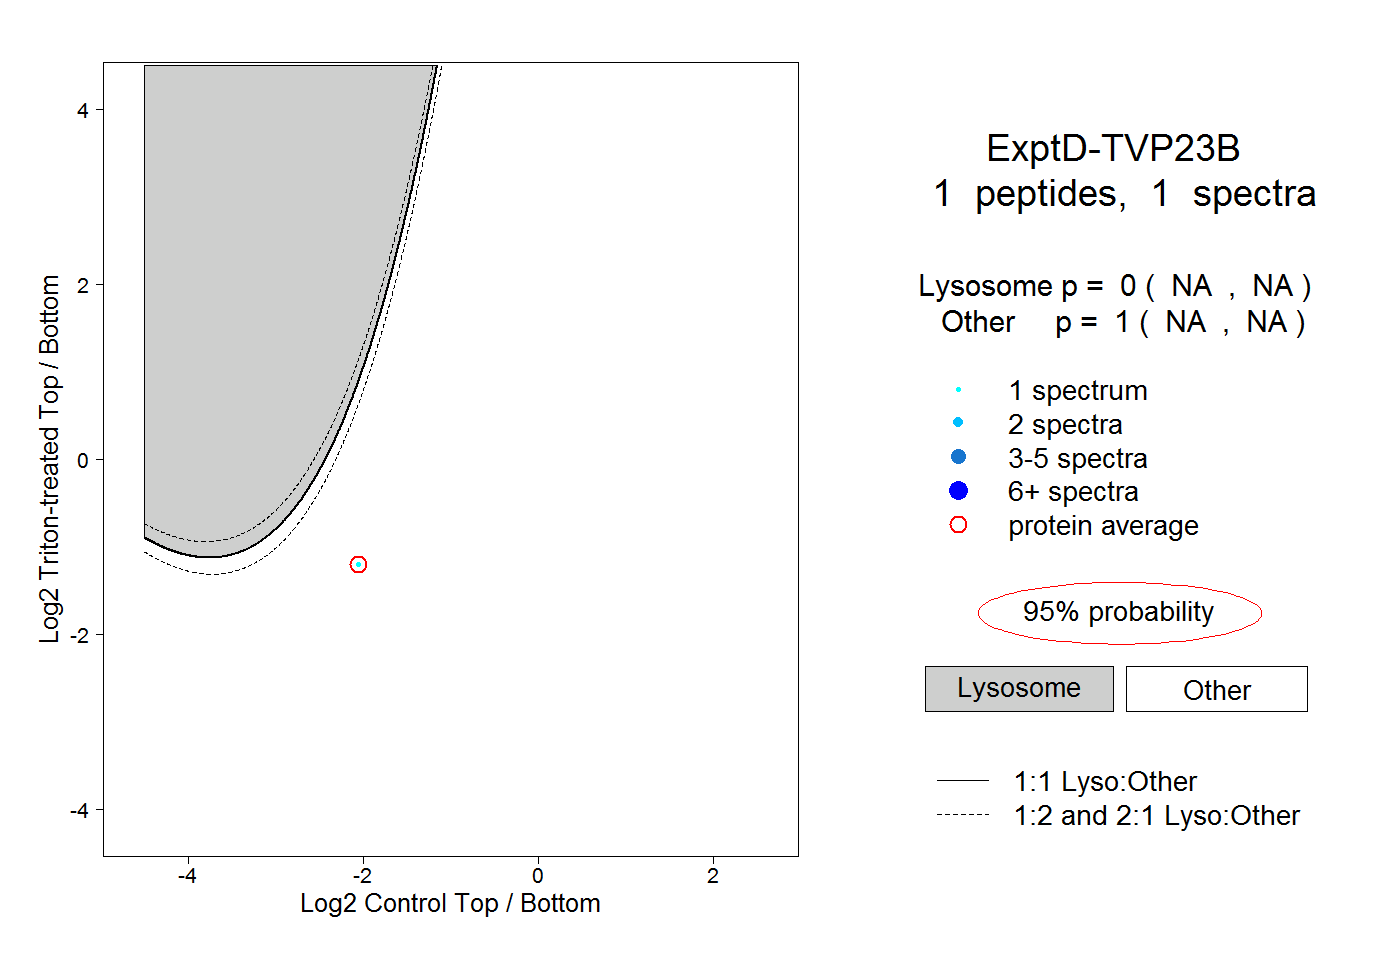 |
0.000 NA | NA |
1.000 NA | NA |