5
5peptides
spectra
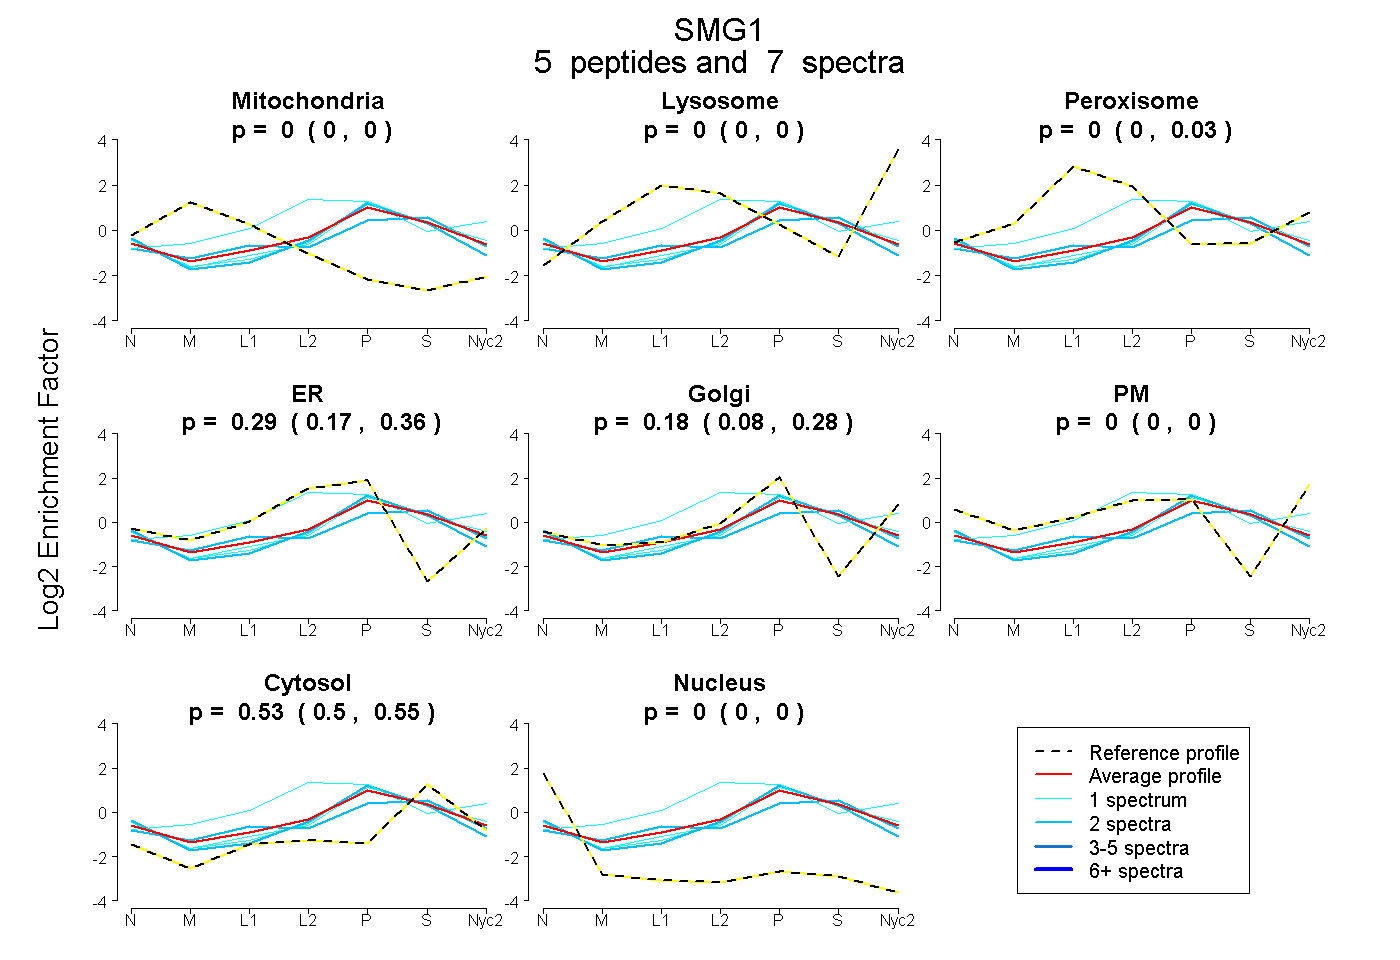
0.000 | 0.000
0.000 | 0.000
0.000 | 0.034
0.171 | 0.362
0.080 | 0.277
0.000 | 0.000
0.497 | 0.550
0.000 | 0.000
6peptides
spectra
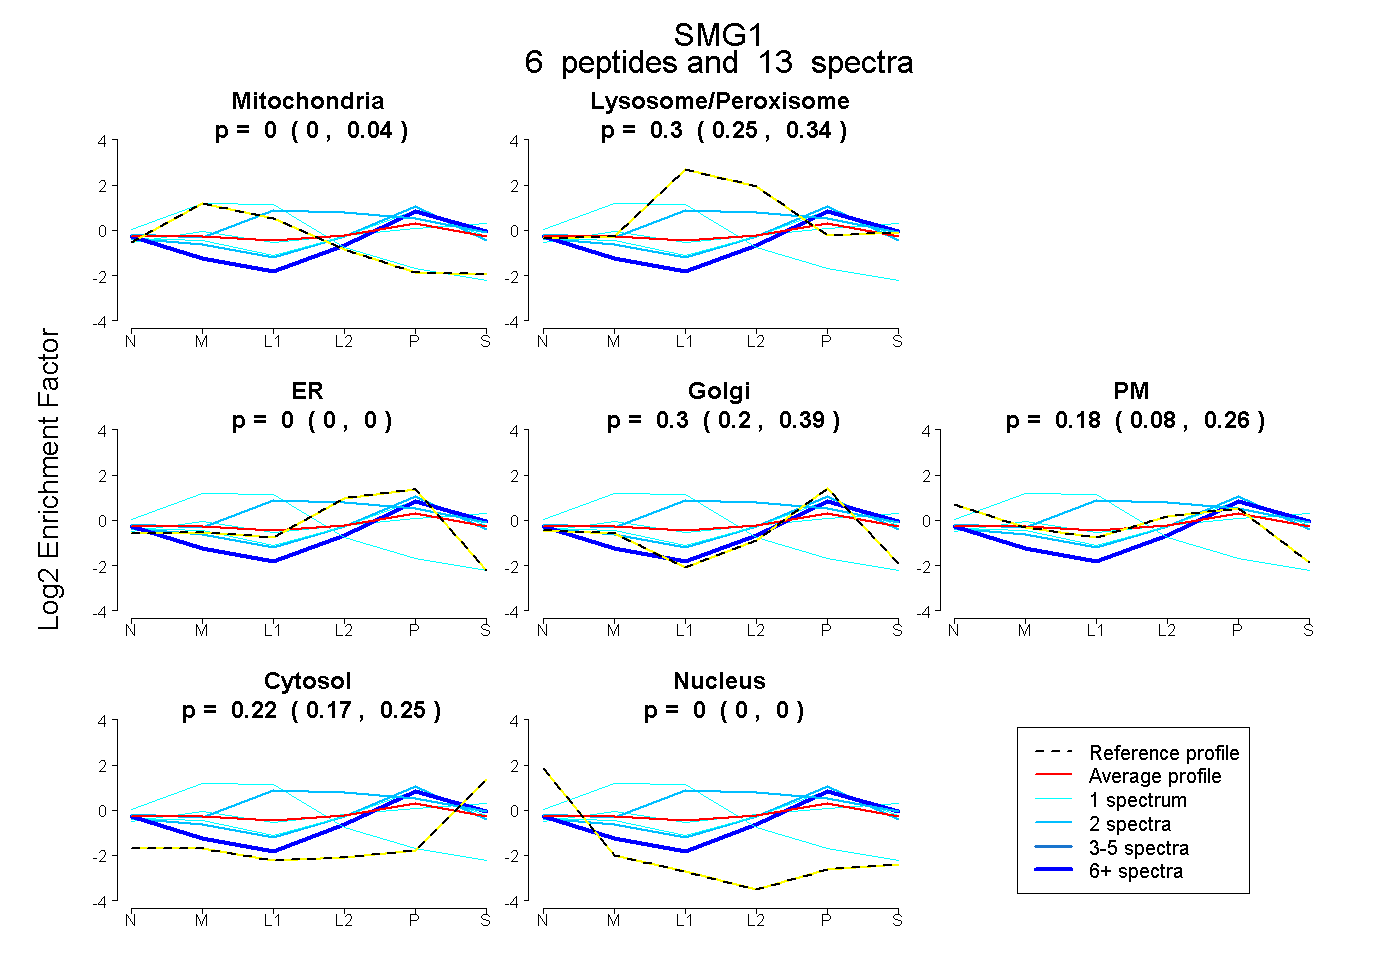
0.000 | 0.040
0.245 | 0.343
0.000 | 0.000
0.195 | 0.387
0.077 | 0.257
0.172 | 0.249
0.000 | 0.000