 2
2peptides
spectra
0.000 | 0.000
0.000 | 0.161
0.000 | 0.130
0.000 | 0.000
0.000 | 0.143
0.251 | 0.464
0.393 | 0.493
0.000 | 0.000
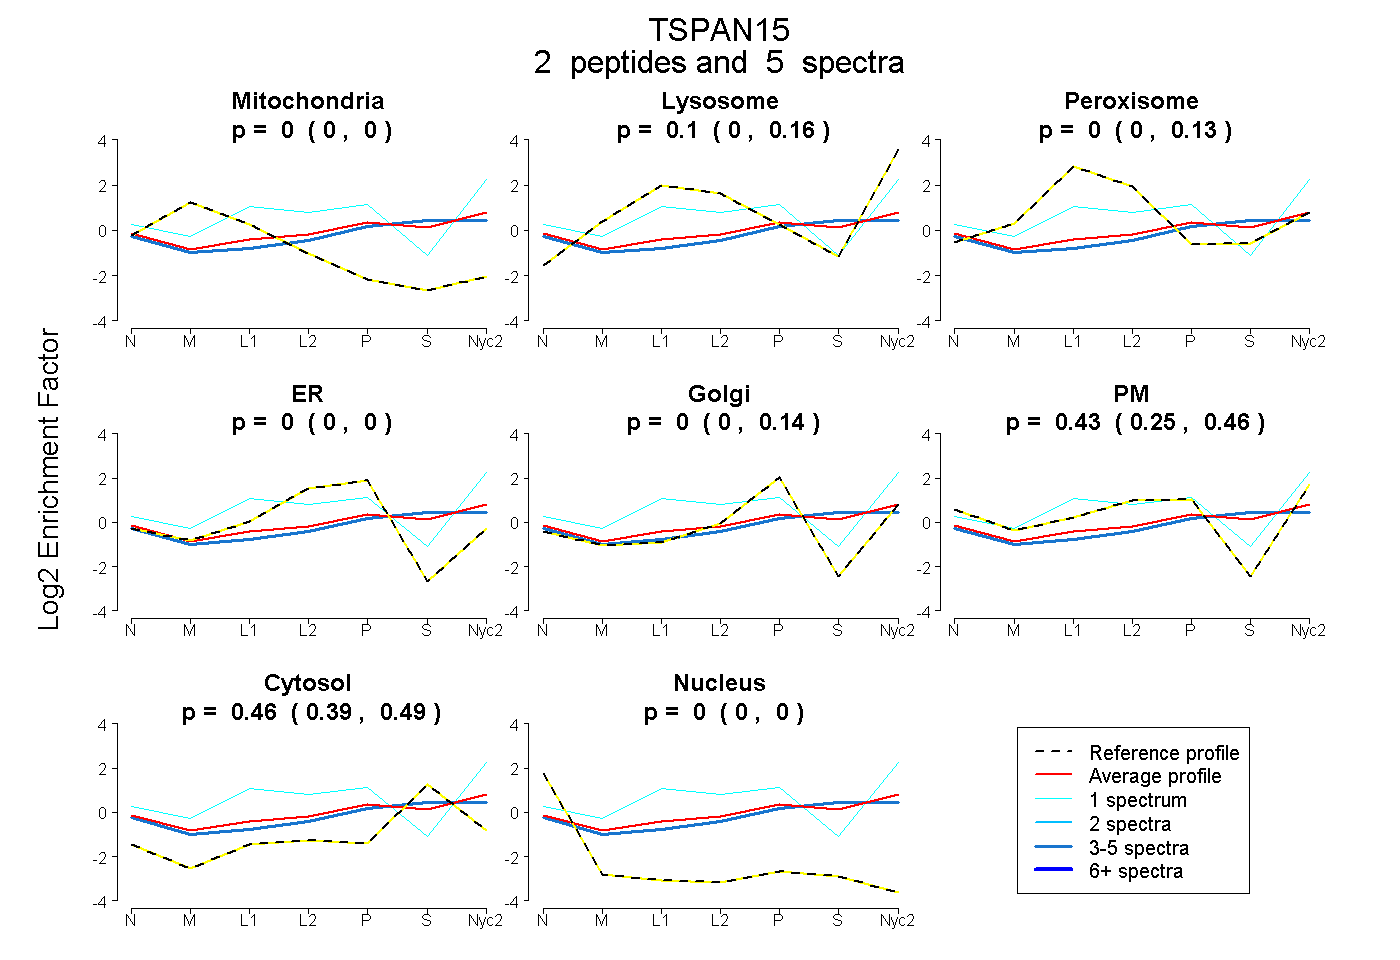
| Plot | Mito | Lyso | Perox | ER | Golgi | PM | Cytosol | Nucleus | |||||
| Expt A |
2 peptides |
5 spectra |
|
0.000 0.000 | 0.000 |
0.101 0.000 | 0.161 |
0.005 0.000 | 0.130 |
0.000 0.000 | 0.000 |
0.001 0.000 | 0.143 |
0.433 0.251 | 0.464 |
0.461 0.393 | 0.493 |
0.000 0.000 | 0.000 |
| 4 spectra, LNAQNIIHVR | 0.000 | 0.048 | 0.000 | 0.000 | 0.013 | 0.381 | 0.558 | 0.000 | ||
| 1 spectrum, GDSEQVR | 0.000 | 0.297 | 0.060 | 0.000 | 0.000 | 0.586 | 0.057 | 0.000 |