 4
4peptides
spectra
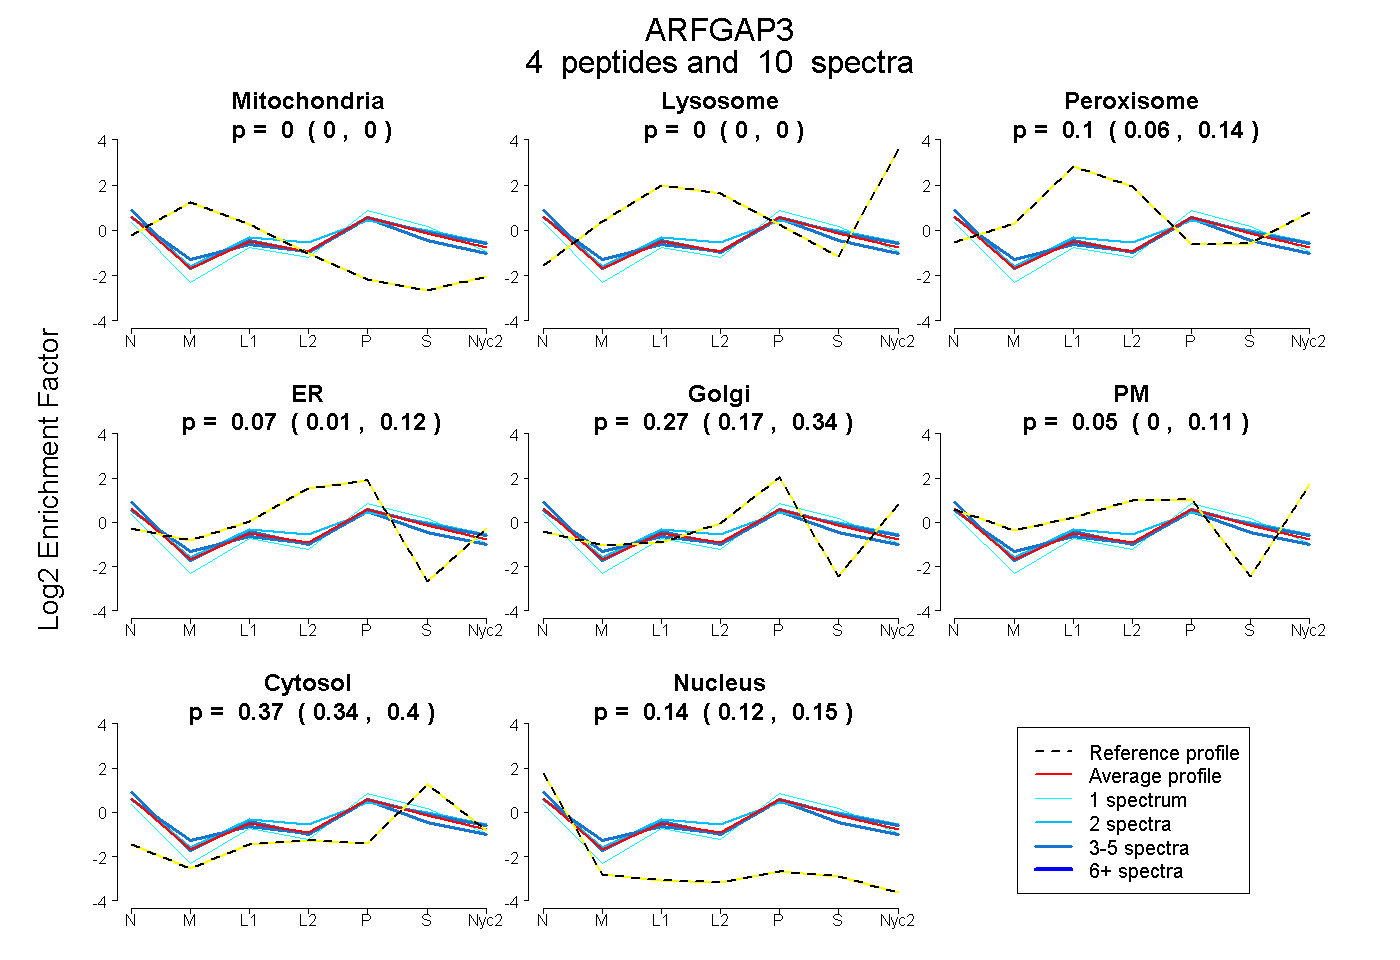
0.000 | 0.000
0.000 | 0.000
0.059 | 0.135
0.009 | 0.123
0.174 | 0.339
0.000 | 0.108
0.340 | 0.399
0.120 | 0.149
2peptides
spectra
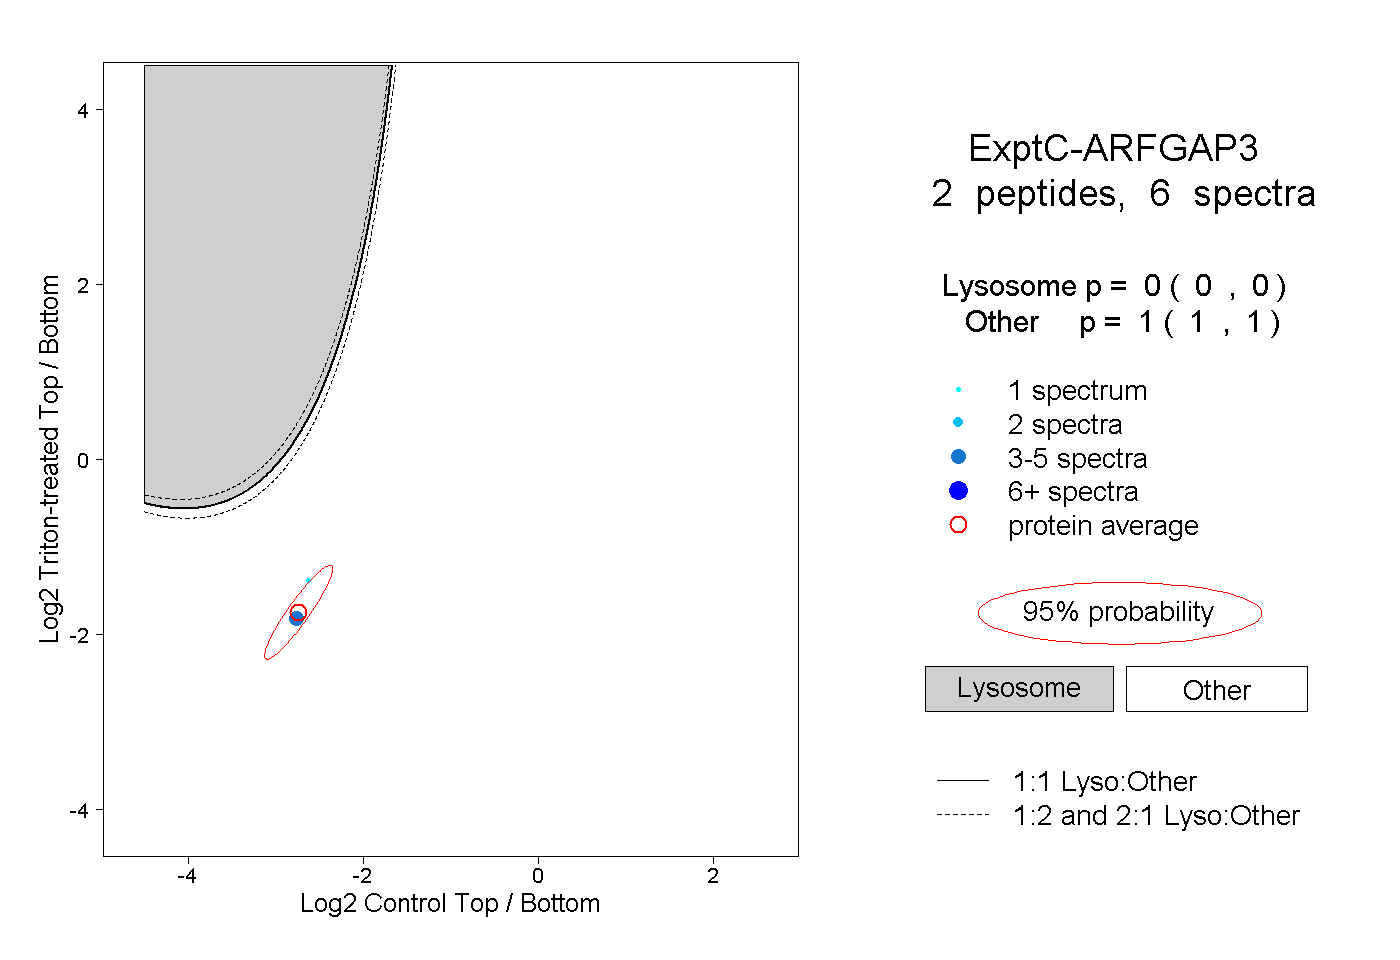
0.000 | 0.000
1.000 | 1.000
| Plot | Mito | Lyso | Perox | ER | Golgi | PM | Cytosol | Nucleus | |||||
| Expt A |
4 peptides |
10 spectra |
|
0.000 0.000 | 0.000 |
0.000 0.000 | 0.000 |
0.104 0.059 | 0.135 |
0.066 0.009 | 0.123 |
0.271 0.174 | 0.339 |
0.052 0.000 | 0.108 |
0.372 0.340 | 0.399 |
0.135 0.120 | 0.149 |
||
| Plot | Lyso | Other | |||||||||||
| Expt C |
2 peptides |
6 spectra |
|
0.000 0.000 | 0.000 |
1.000 1.000 | 1.000 |