15
15peptides
spectra
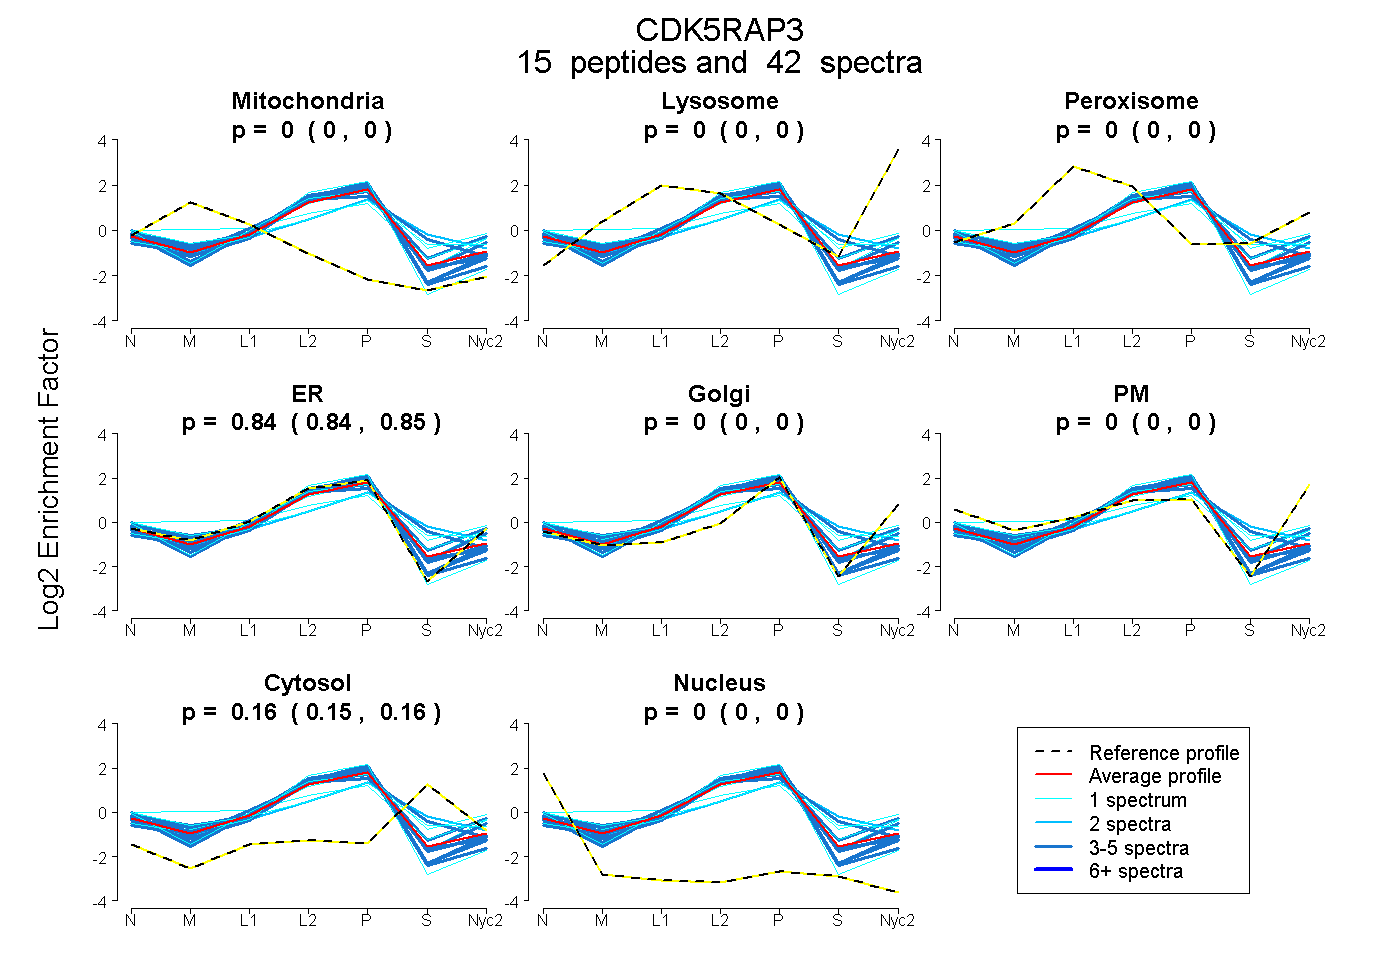
0.000 | 0.000
0.000 | 0.000
0.000 | 0.000
0.835 | 0.847
0.000 | 0.000
0.000 | 0.000
0.152 | 0.164
0.000 | 0.000
10peptides
spectra
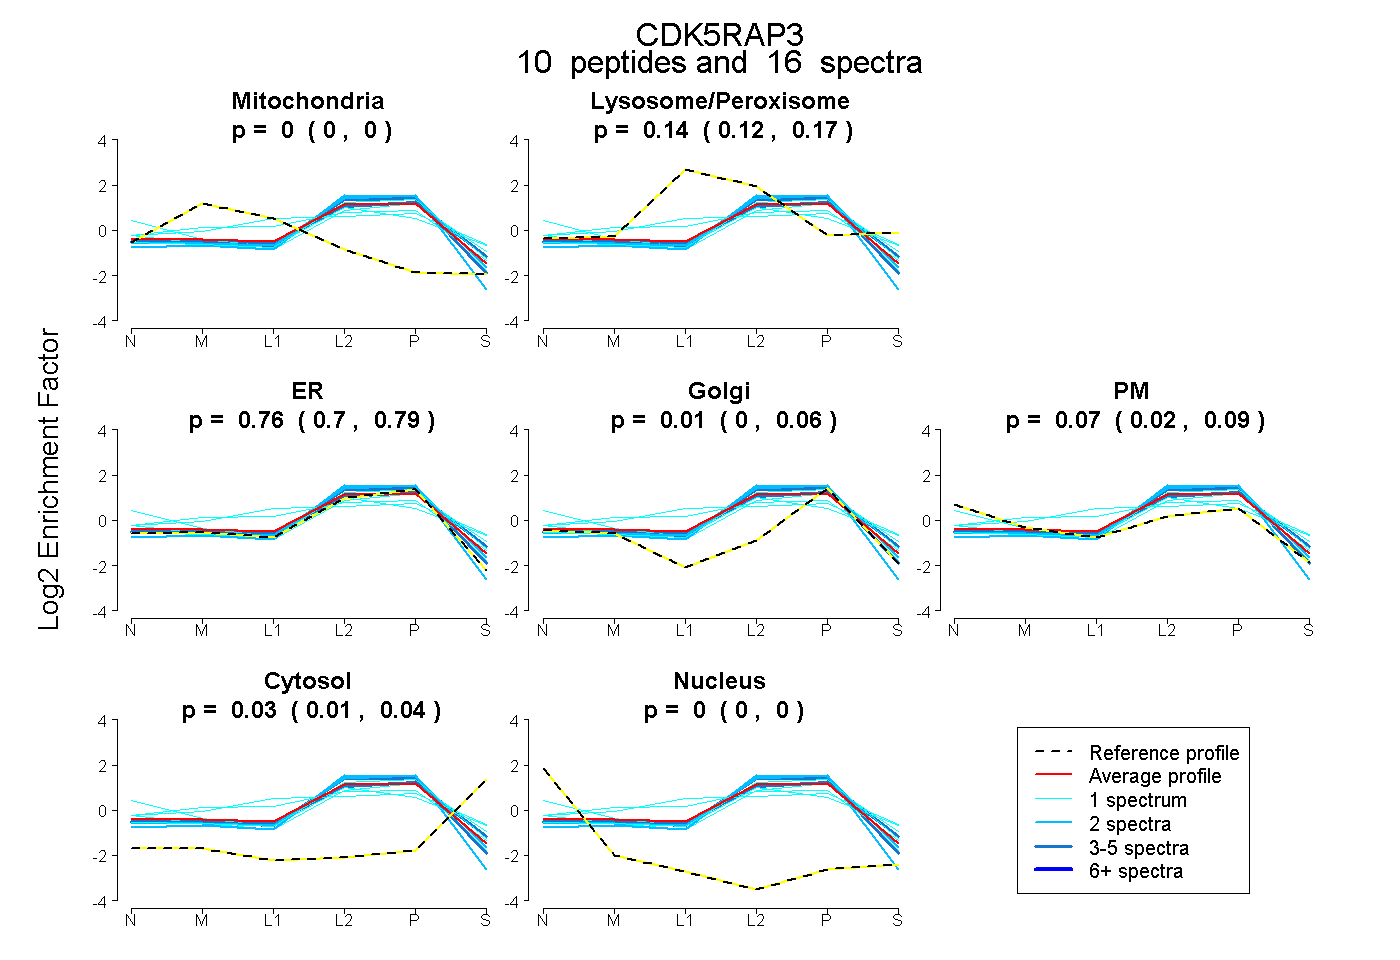
0.000 | 0.000
0.120 | 0.165
0.701 | 0.786
0.000 | 0.058
0.024 | 0.094
0.011 | 0.038
0.000 | 0.000