 15
15peptides
spectra
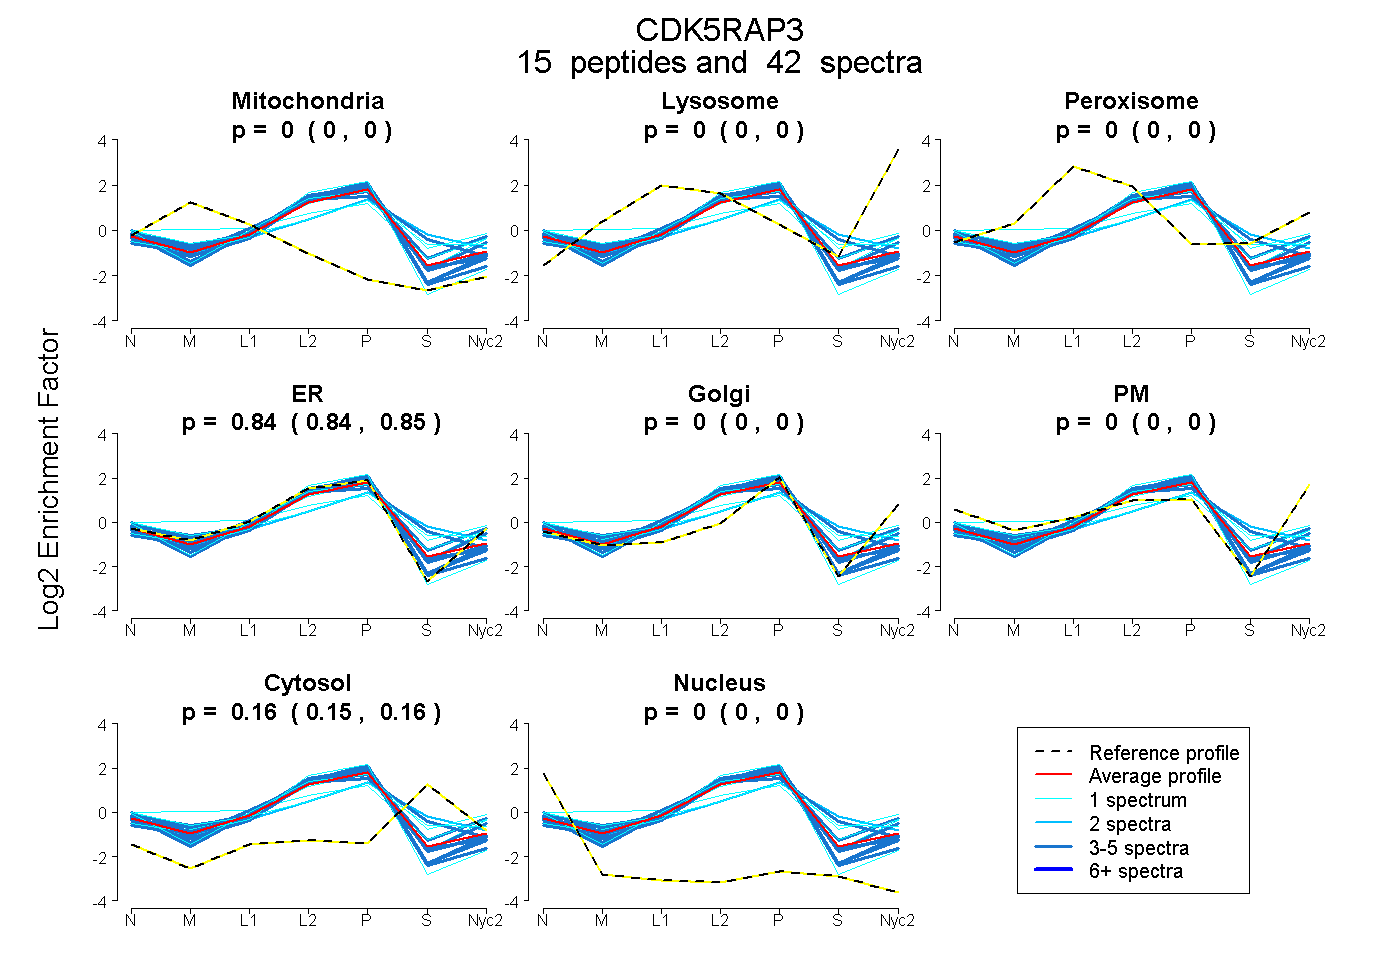
0.000 | 0.000
0.000 | 0.000
0.000 | 0.000
0.835 | 0.847
0.000 | 0.000
0.000 | 0.000
0.152 | 0.164
0.000 | 0.000
| Plot | Mito | Lyso | Perox | ER | Golgi | PM | Cytosol | Nucleus | |||||
| Expt A |
15 peptides |
42 spectra |
|
0.000 0.000 | 0.000 |
0.000 0.000 | 0.000 |
0.000 0.000 | 0.000 |
0.841 0.835 | 0.847 |
0.000 0.000 | 0.000 |
0.000 0.000 | 0.000 |
0.159 0.152 | 0.164 |
0.000 0.000 | 0.000 |
| 3 spectra, LDLLLEK | 0.000 | 0.000 | 0.000 | 0.918 | 0.000 | 0.000 | 0.024 | 0.058 | ||
| 2 spectra, EQFYHSCK | 0.000 | 0.000 | 0.043 | 0.579 | 0.000 | 0.000 | 0.378 | 0.000 | ||
| 1 spectrum, YNGRPVNLMGTSV | 0.000 | 0.000 | 0.000 | 0.943 | 0.000 | 0.000 | 0.000 | 0.057 | ||
| 5 spectra, GSDALTLLEYPETR | 0.000 | 0.000 | 0.000 | 0.864 | 0.000 | 0.000 | 0.136 | 0.000 | ||
| 4 spectra, ELLALVK | 0.018 | 0.000 | 0.000 | 0.939 | 0.000 | 0.000 | 0.020 | 0.022 | ||
| 1 spectrum, VTELLQQK | 0.002 | 0.000 | 0.095 | 0.572 | 0.049 | 0.000 | 0.282 | 0.000 | ||
| 4 spectra, CQQLQQDYSR | 0.000 | 0.000 | 0.068 | 0.780 | 0.000 | 0.000 | 0.151 | 0.000 | ||
| 1 spectrum, DNTYLVELSSLLVR | 0.000 | 0.000 | 0.011 | 0.818 | 0.000 | 0.048 | 0.123 | 0.000 | ||
| 1 spectrum, NVNYEIPSLK | 0.000 | 0.000 | 0.076 | 0.715 | 0.000 | 0.000 | 0.209 | 0.000 | ||
| 3 spectra, LLDWLVDR | 0.000 | 0.000 | 0.000 | 0.876 | 0.000 | 0.000 | 0.123 | 0.001 | ||
| 1 spectrum, DAGADK | 0.105 | 0.000 | 0.186 | 0.434 | 0.188 | 0.000 | 0.087 | 0.000 | ||
| 5 spectra, IVDLIK | 0.000 | 0.000 | 0.022 | 0.674 | 0.000 | 0.000 | 0.304 | 0.000 | ||
| 4 spectra, DLMVEK | 0.000 | 0.000 | 0.000 | 0.882 | 0.000 | 0.000 | 0.118 | 0.000 | ||
| 4 spectra, GTEASTK | 0.000 | 0.000 | 0.000 | 0.897 | 0.000 | 0.000 | 0.000 | 0.103 | ||
| 3 spectra, MQHLFMILASPR | 0.000 | 0.000 | 0.022 | 0.864 | 0.000 | 0.000 | 0.114 | 0.000 |
| Plot | Mito | Lyso or Perox | ER | Golgi | PM | Cytosol | Nucleus | ||||||
| Expt B |
10 peptides |
16 spectra |
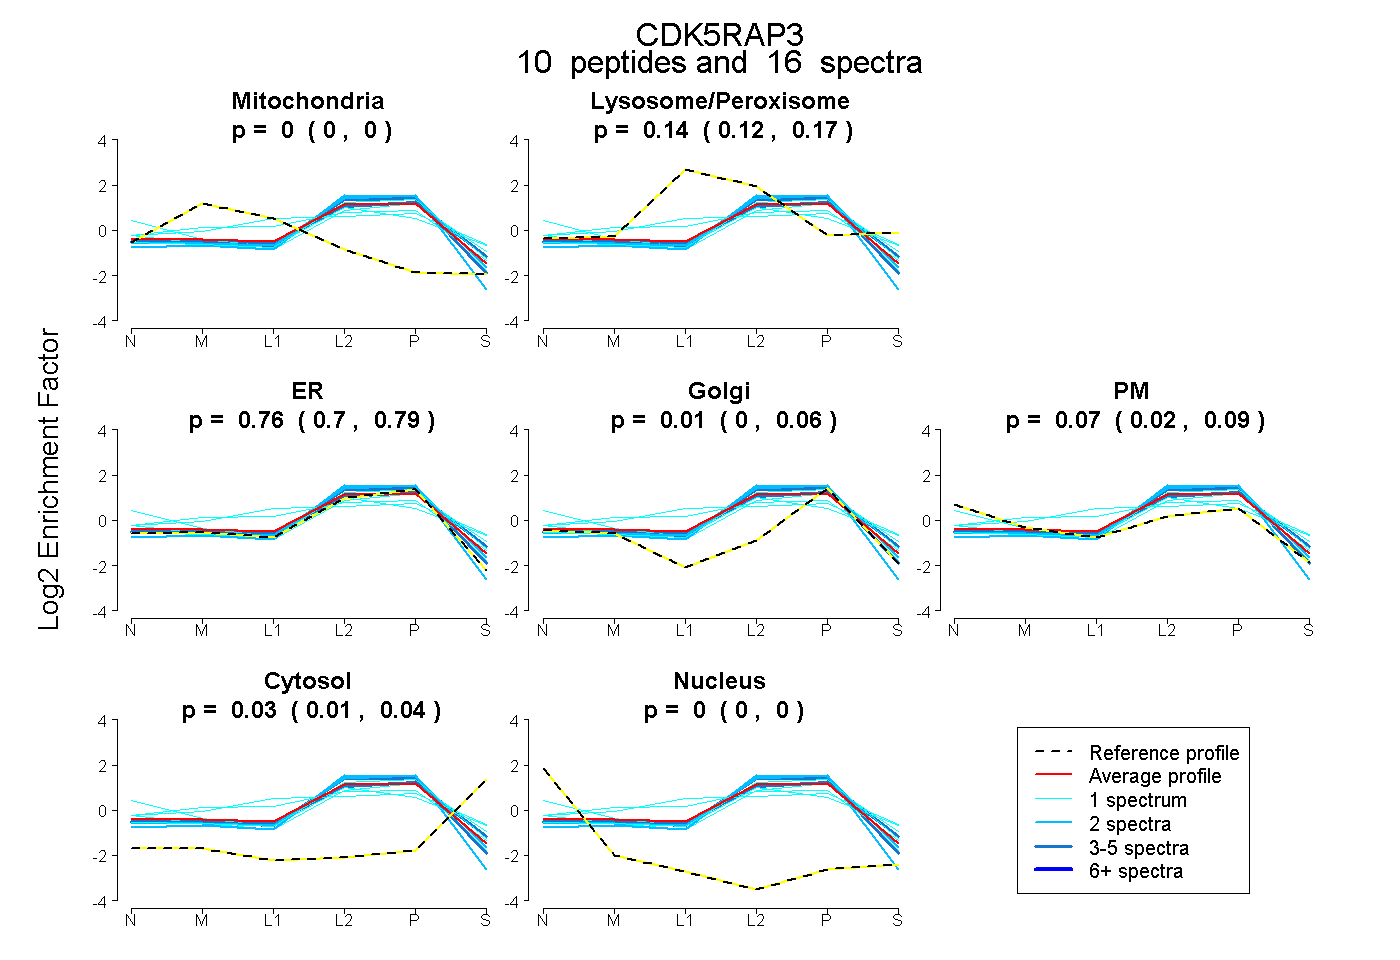 |
0.000 0.000 | 0.000 |
0.139 0.120 | 0.165 |
0.761 0.701 | 0.786 |
0.007 0.000 | 0.058 |
0.066 0.024 | 0.094 |
0.028 0.011 | 0.038 |
0.000 0.000 | 0.000 |
|||
| Plot | Lyso | Other | |||||||||||
| Expt C |
17 peptides |
95 spectra |
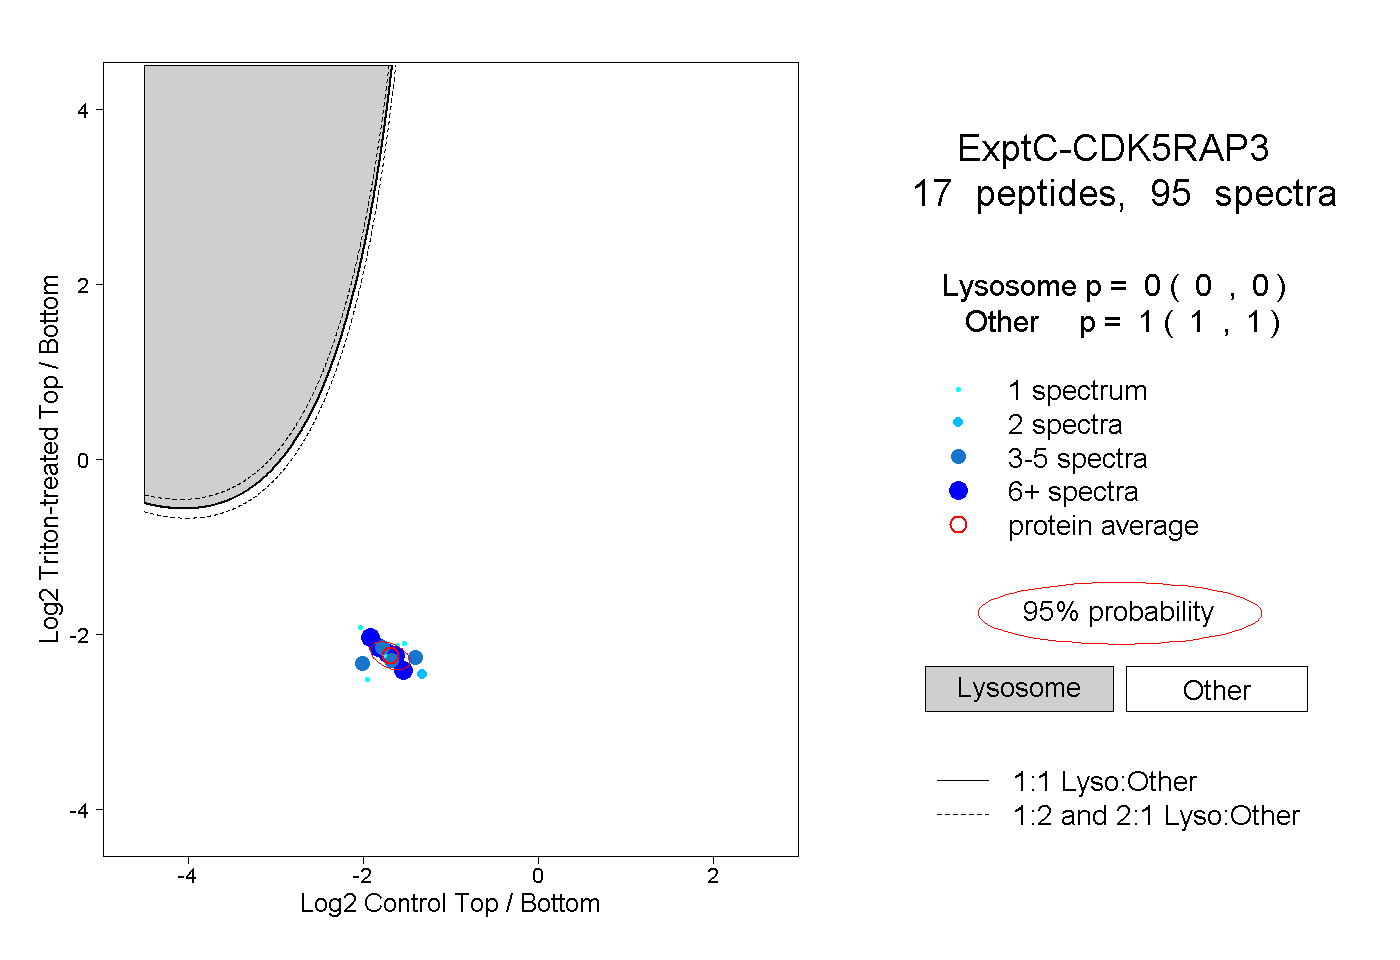 |
0.000 0.000 | 0.000 |
1.000 1.000 | 1.000 |
||||||||
| Plot | Lyso | Other | |||||||||||
| Expt D |
7 peptides |
16 spectra |
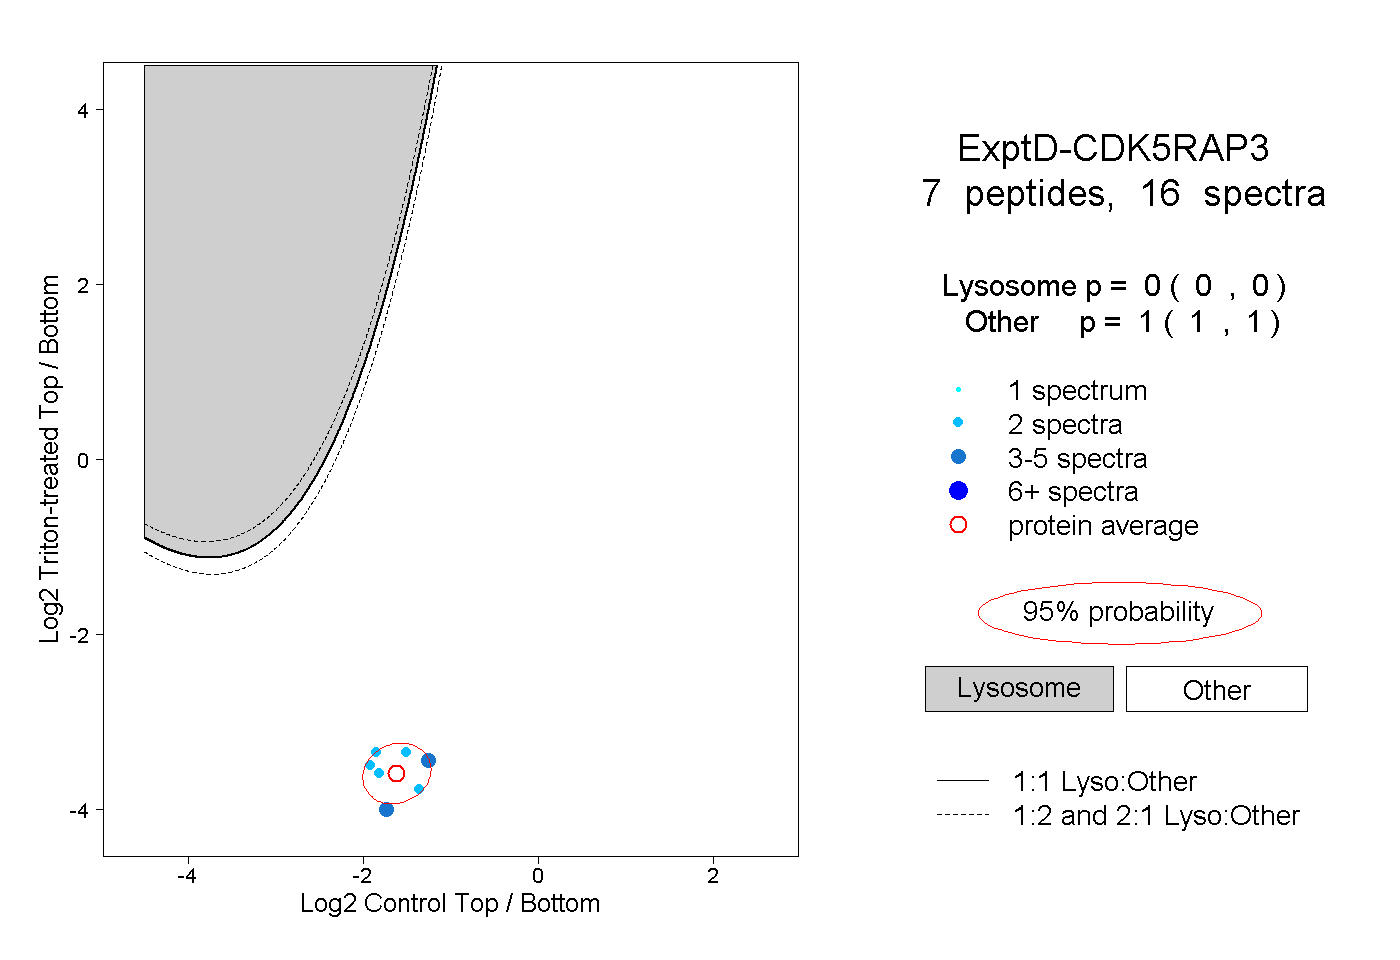 |
0.000 0.000 | 0.000 |
1.000 1.000 | 1.000 |