 3
3peptides
spectra
0.000 | 0.000
0.181 | 0.409
0.141 | 0.420
0.000 | 0.122
0.000 | 0.000
0.241 | 0.465
0.000 | 0.036
0.000 | 0.000
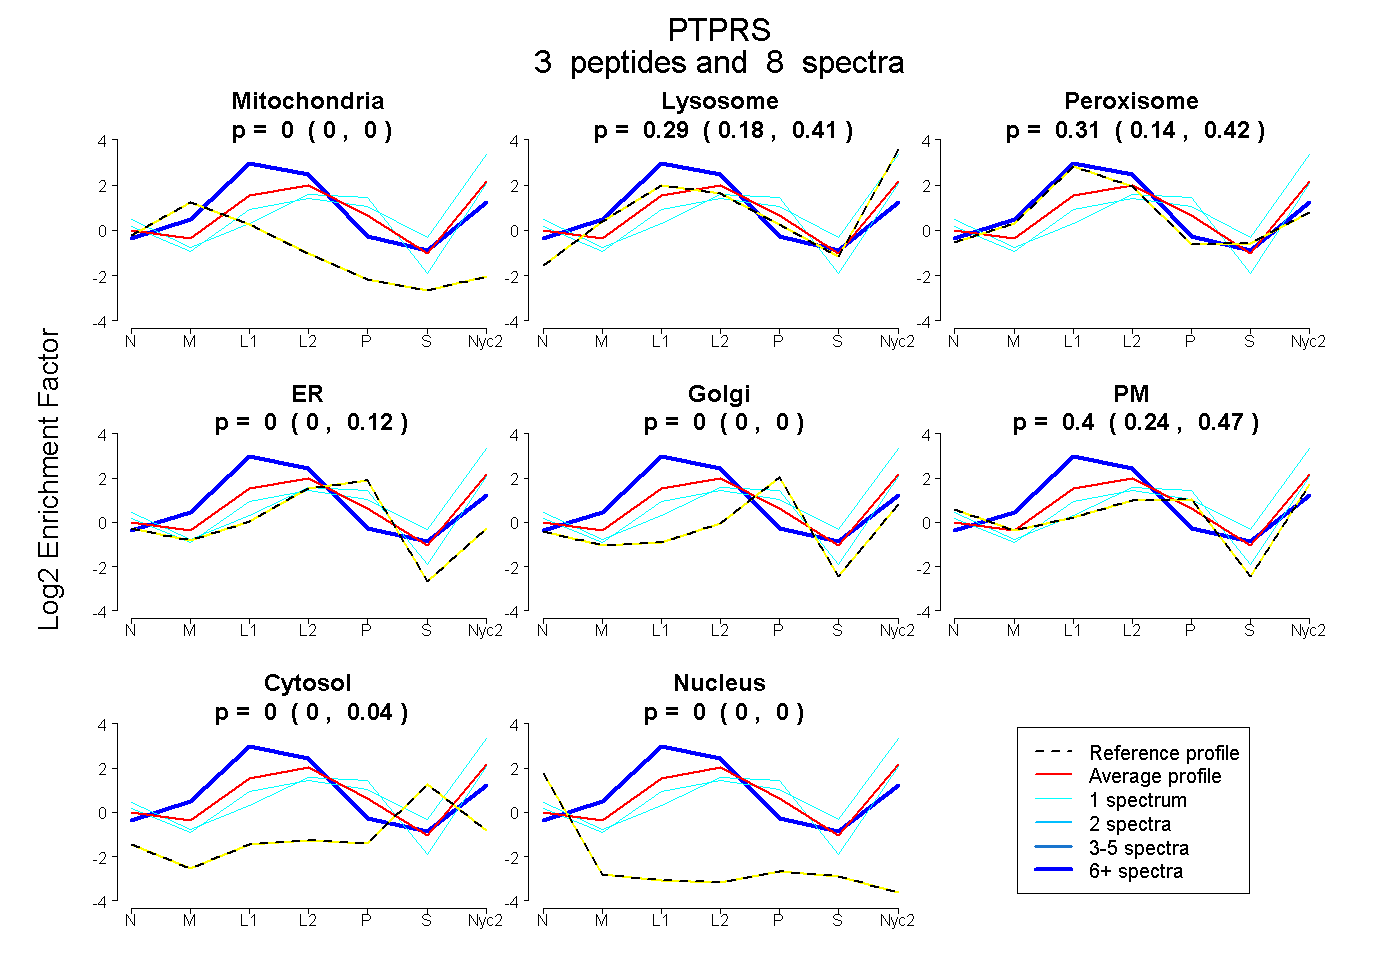
| Plot | Mito | Lyso | Perox | ER | Golgi | PM | Cytosol | Nucleus | |||||
| Expt A |
3 peptides |
8 spectra |
|
0.000 0.000 | 0.000 |
0.287 0.181 | 0.409 |
0.310 0.141 | 0.420 |
0.000 0.000 | 0.122 |
0.000 0.000 | 0.000 |
0.403 0.241 | 0.465 |
0.000 0.000 | 0.036 |
0.000 0.000 | 0.000 |
| 1 spectrum, FETIDFDESSGAVLR | 0.000 | 0.127 | 0.000 | 0.080 | 0.000 | 0.792 | 0.000 | 0.000 | ||
| 6 spectra, ENGSLK | 0.000 | 0.113 | 0.887 | 0.000 | 0.000 | 0.000 | 0.000 | 0.000 | ||
| 1 spectrum, SPQGLGAFTAVVR | 0.000 | 0.543 | 0.000 | 0.000 | 0.000 | 0.376 | 0.080 | 0.000 |
| Plot | Lyso | Other | |||||||||||
| Expt C |
14 peptides |
22 spectra |
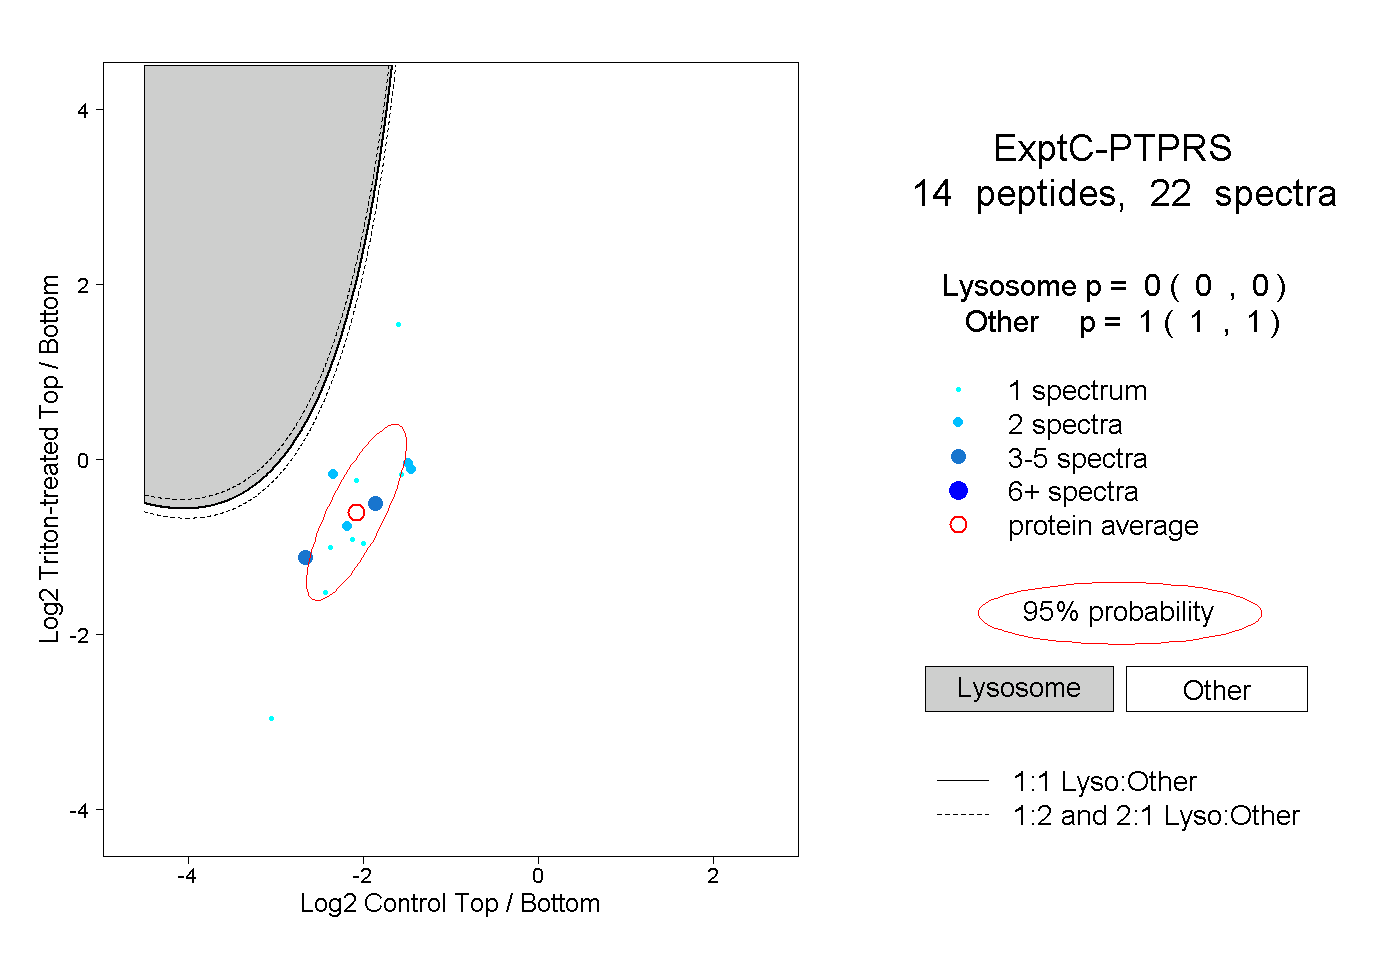 |
0.000 0.000 | 0.000 |
1.000 1.000 | 1.000 |
||||||||
| Plot | Lyso | Other | |||||||||||
| Expt D |
1 peptide |
2 spectra |
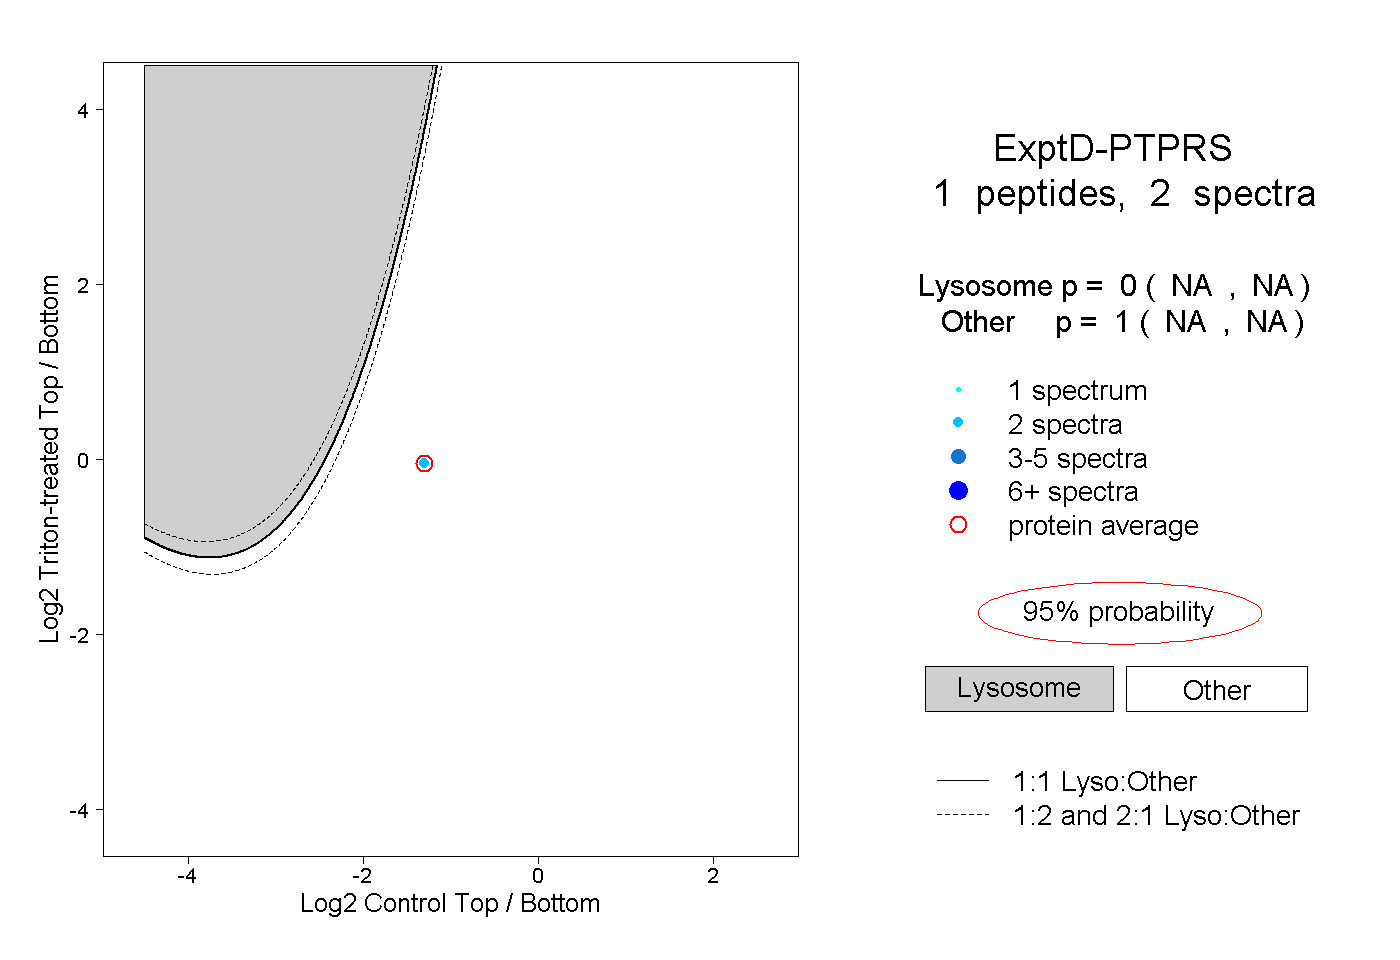 |
0.000 NA | NA |
1.000 NA | NA |