 2
2peptides
spectra
0.063 | 0.174
0.068 | 0.290
0.000 | 0.176
0.000 | 0.000
0.000 | 0.084
0.012 | 0.243
0.379 | 0.459
0.000 | 0.000
| Plot | Mito | Lyso | Perox | ER | Golgi | PM | Cytosol | Nucleus | |||||
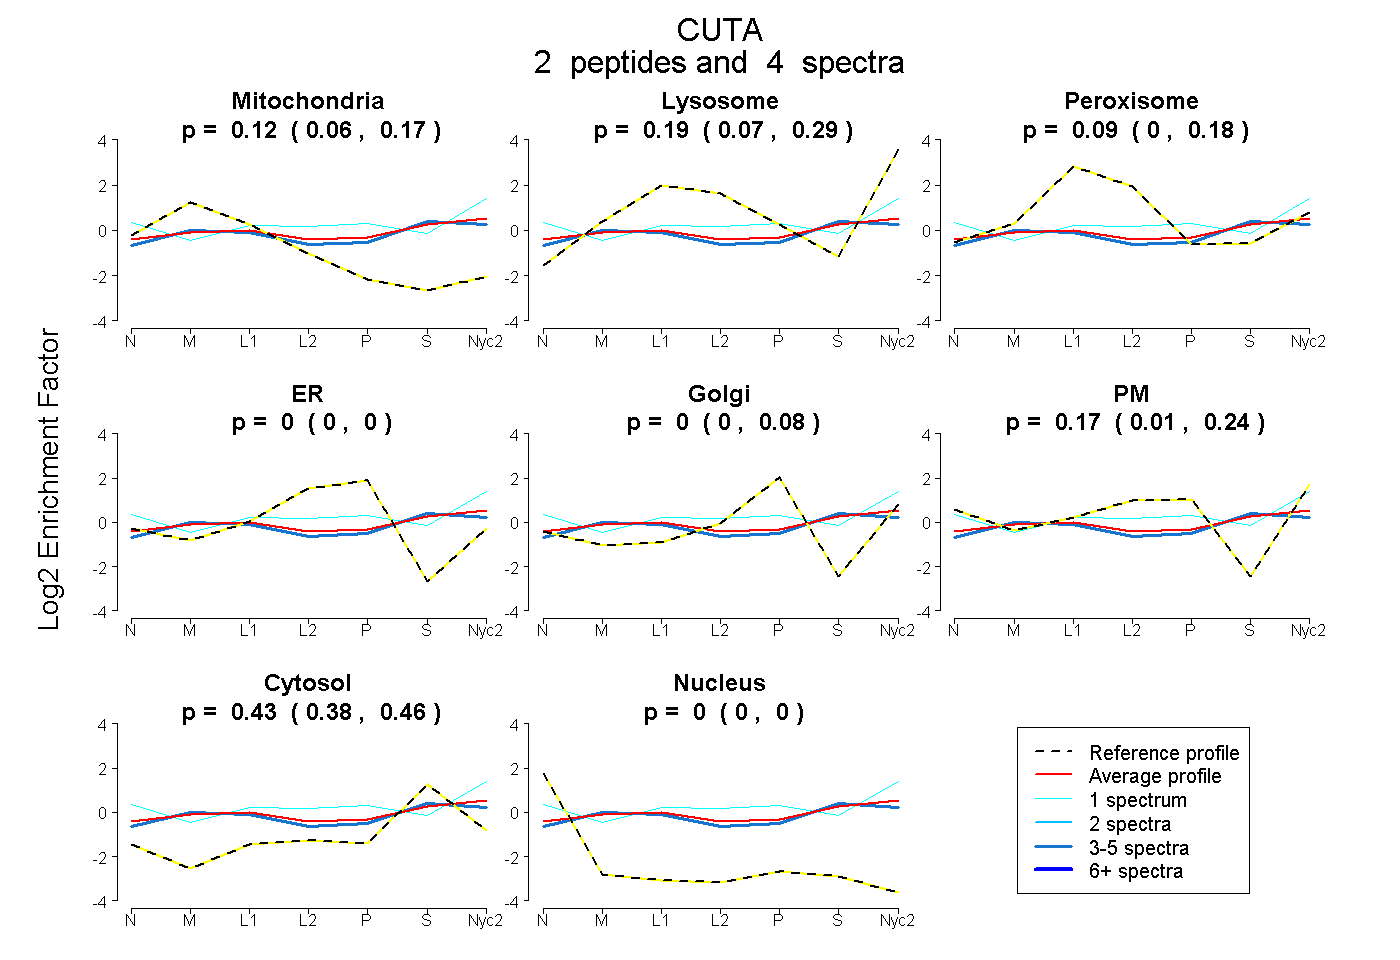
| Expt A |
2 peptides |
4 spectra |
|
0.124 0.063 | 0.174 |
0.191 0.068 | 0.290 |
0.089 0.000 | 0.176 |
0.000 0.000 | 0.000 |
0.000 0.000 | 0.084 |
0.169 0.012 | 0.243 |
0.426 0.379 | 0.459 |
0.000 0.000 | 0.000 |
| 3 spectra, IEEDSEVLMMIK | 0.196 | 0.240 | 0.057 | 0.000 | 0.004 | 0.044 | 0.459 | 0.000 | ||
| 1 spectrum, AVVEK | 0.000 | 0.125 | 0.105 | 0.000 | 0.000 | 0.472 | 0.297 | 0.000 |
| Plot | Lyso | Other | |||||||||||
| Expt C |
2 peptides |
6 spectra |
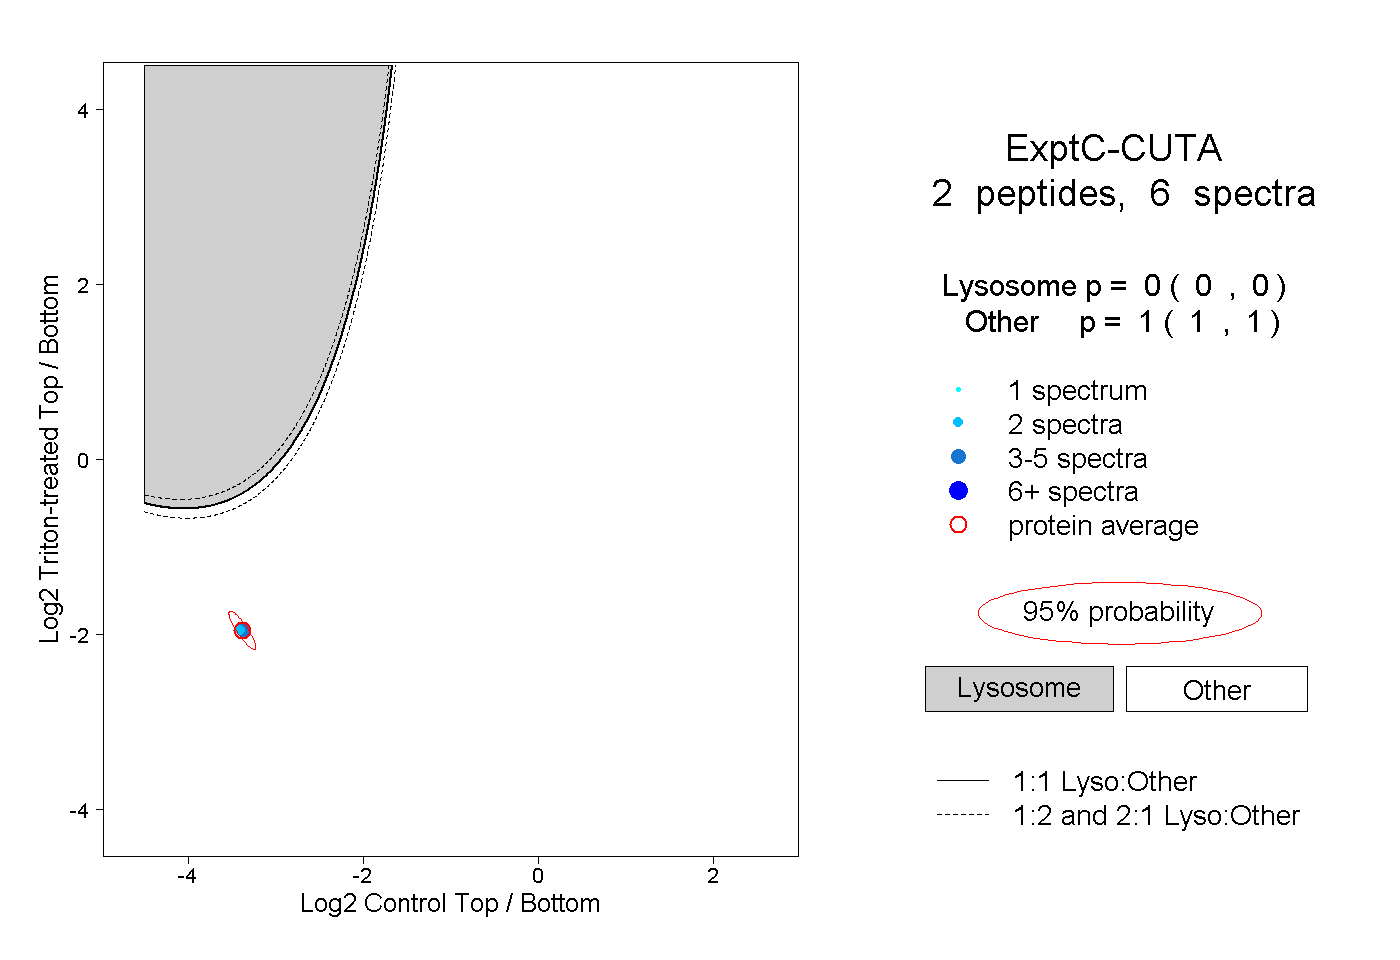 |
0.000 0.000 | 0.000 |
1.000 1.000 | 1.000 |