 1
1peptide
spectrum
NA | NA
NA | NA
NA | NA
NA | NA
NA | NA
NA | NA
NA | NA
NA | NA
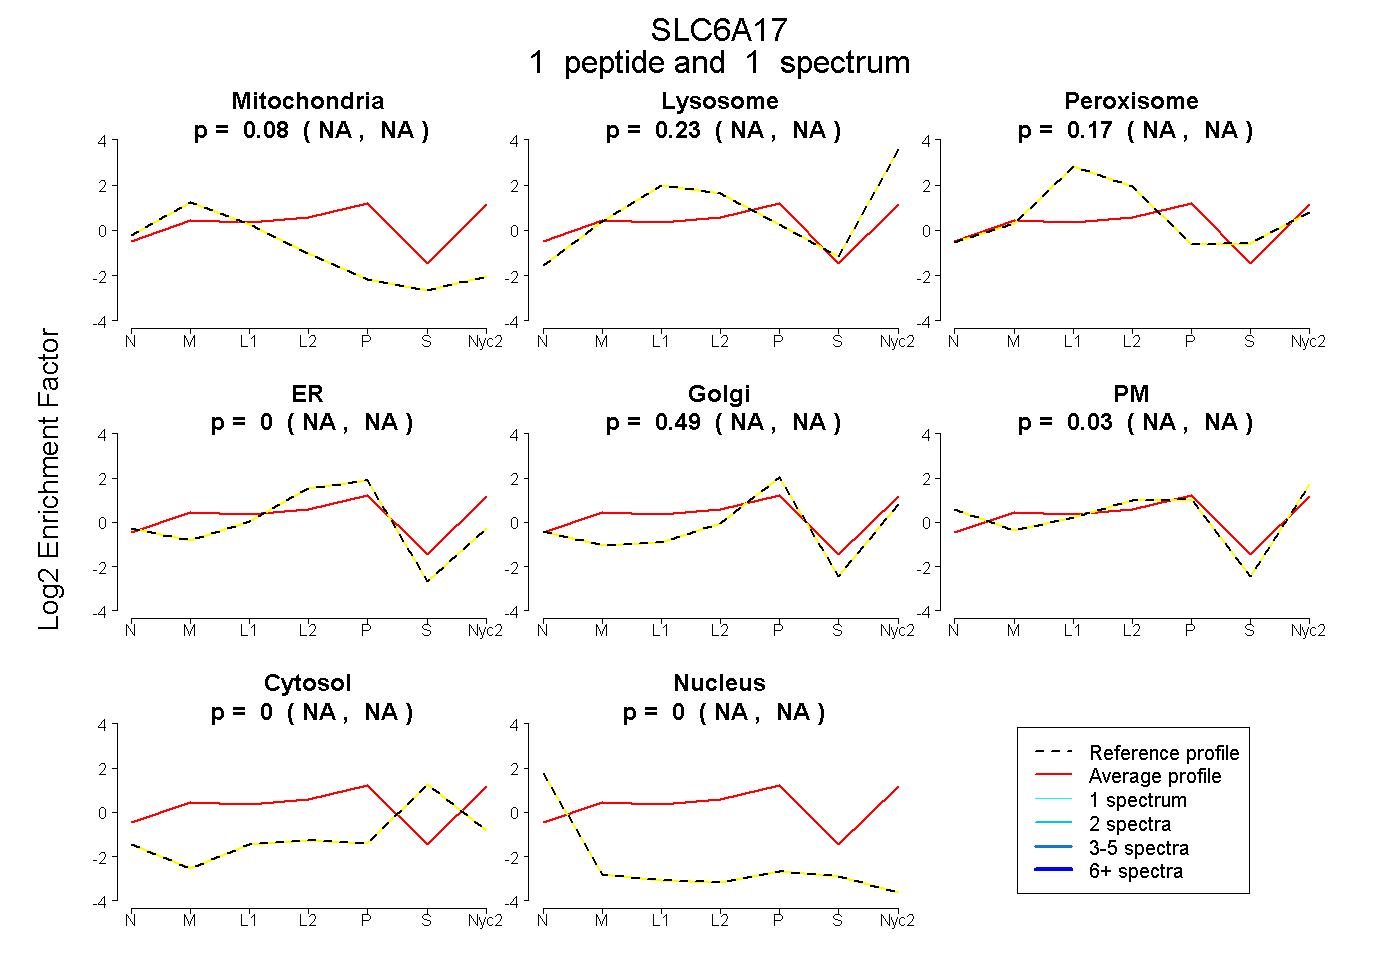
| Plot | Mito | Lyso | Perox | ER | Golgi | PM | Cytosol | Nucleus | |||||
| Expt A |
1 peptide |
1 spectrum |
|
0.081 NA | NA |
0.226 NA | NA |
0.172 NA | NA |
0.000 NA | NA |
0.491 NA | NA |
0.030 NA | NA |
0.000 NA | NA |
0.000 NA | NA |
| 1 spectrum, HFHLLSDGSNTLSVSYK | 0.081 | 0.226 | 0.172 | 0.000 | 0.491 | 0.030 | 0.000 | 0.000 |