 3
3peptides
spectra
0.000 | 0.000
0.046 | 0.181
0.000 | 0.131
0.000 | 0.000
0.415 | 0.506
0.000 | 0.030
0.299 | 0.371
0.000 | 0.000
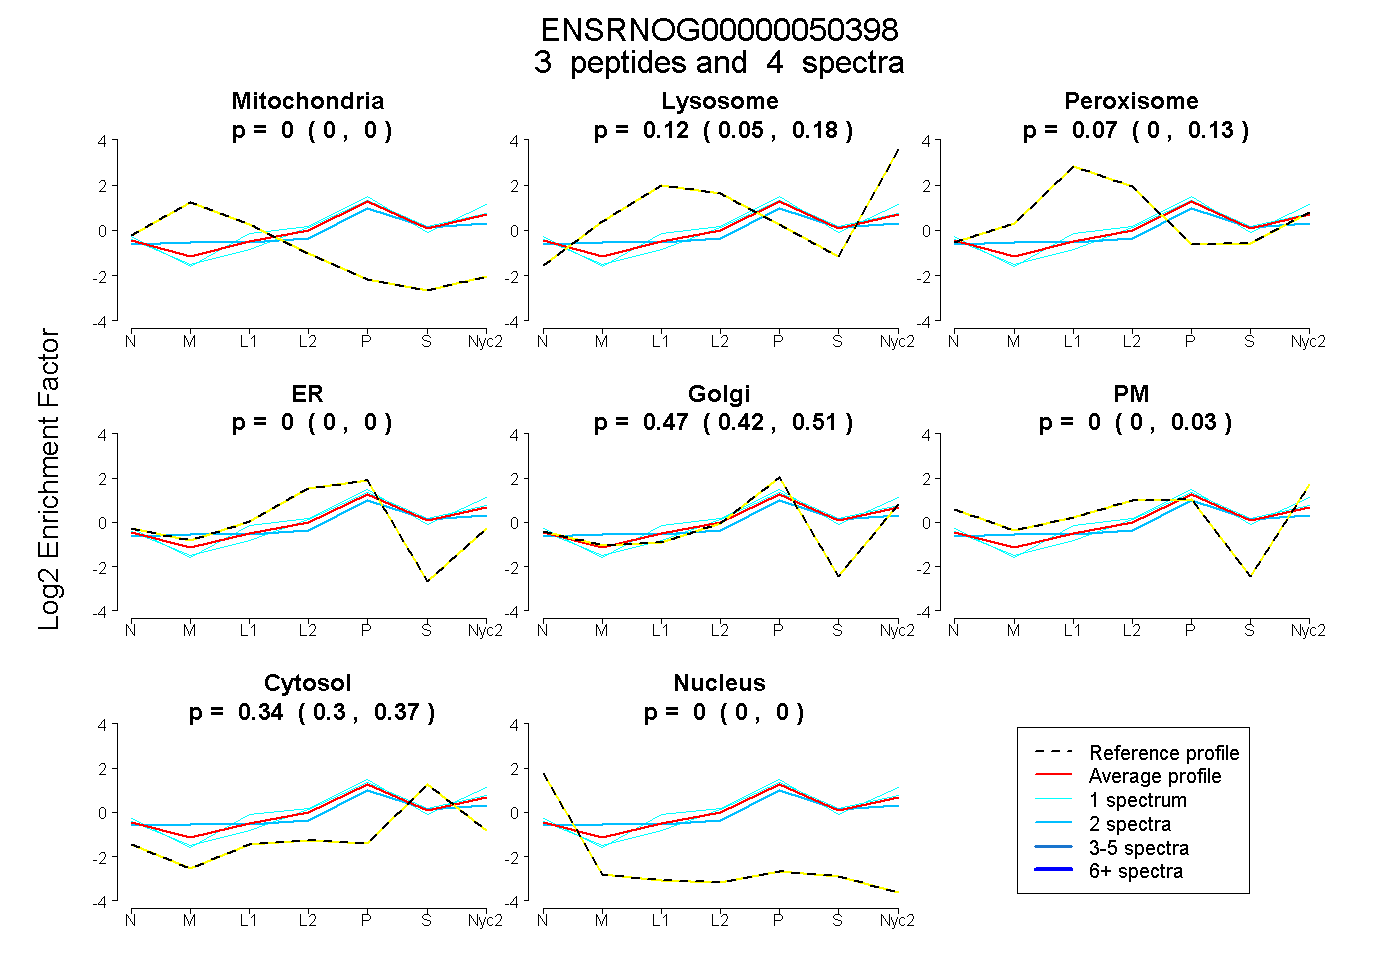
| Plot | Mito | Lyso | Perox | ER | Golgi | PM | Cytosol | Nucleus | |||||
| Expt A |
3 peptides |
4 spectra |
|
0.000 0.000 | 0.000 |
0.119 0.046 | 0.181 |
0.071 0.000 | 0.131 |
0.000 0.000 | 0.000 |
0.473 0.415 | 0.506 |
0.000 0.000 | 0.030 |
0.337 0.299 | 0.371 |
0.000 0.000 | 0.000 |
| 2 spectra, SPFIYSPIIAHNR | 0.000 | 0.050 | 0.143 | 0.000 | 0.443 | 0.000 | 0.364 | 0.000 | ||
| 1 spectrum, DVTQSLENYTAK | 0.000 | 0.179 | 0.027 | 0.000 | 0.444 | 0.064 | 0.286 | 0.000 | ||
| 1 spectrum, LLSLPTSLRPQK | 0.000 | 0.121 | 0.000 | 0.000 | 0.463 | 0.043 | 0.373 | 0.000 |