 9
9peptides
spectra
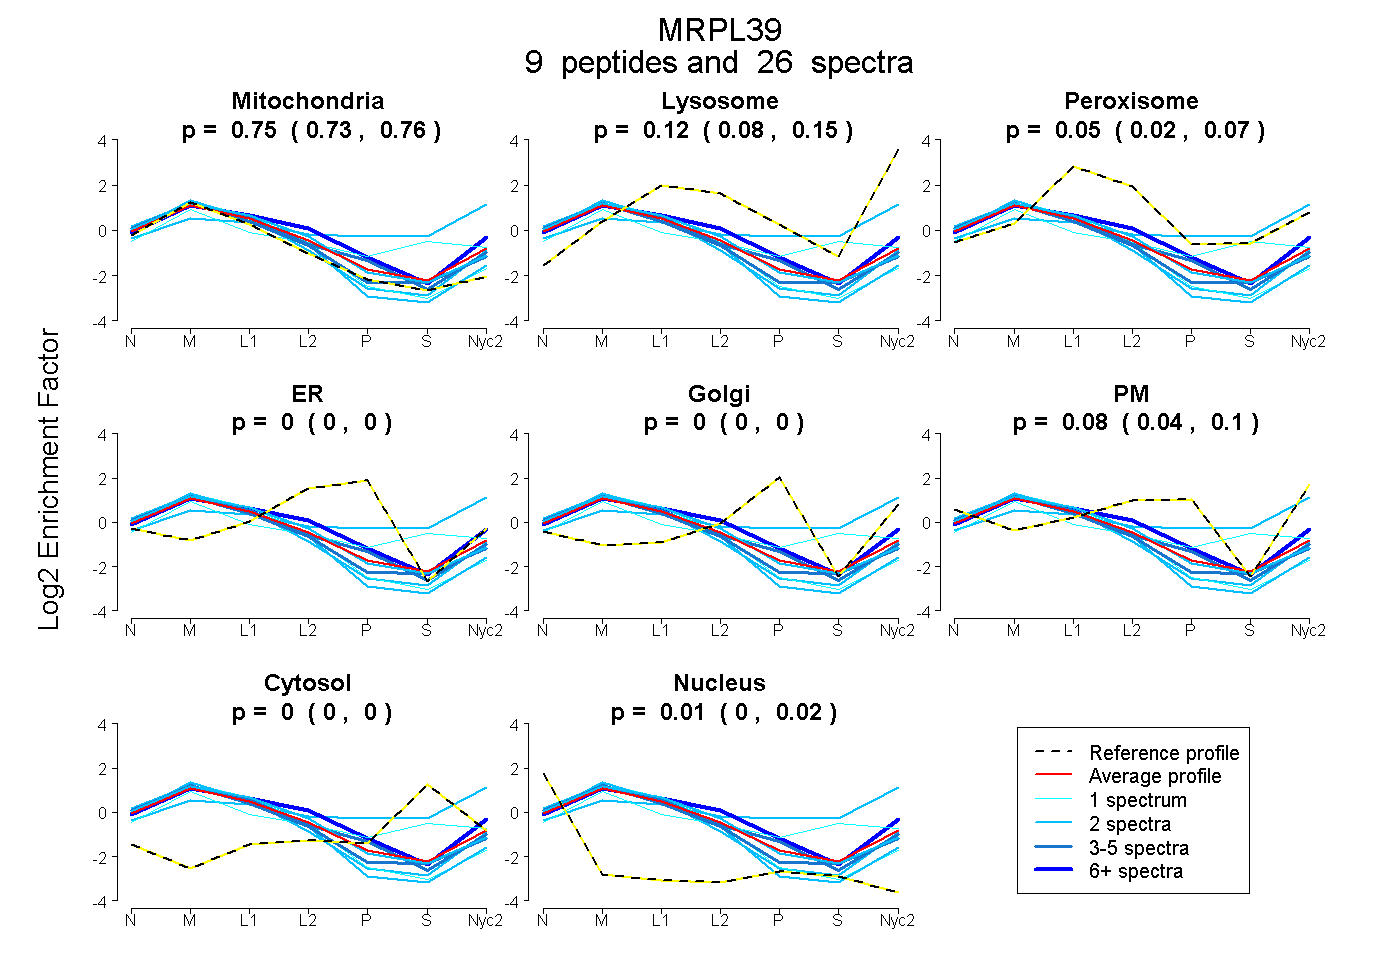
0.729 | 0.764
0.082 | 0.152
0.019 | 0.074
0.000 | 0.000
0.000 | 0.000
0.037 | 0.102
0.000 | 0.000
0.000 | 0.020
4peptides
spectra
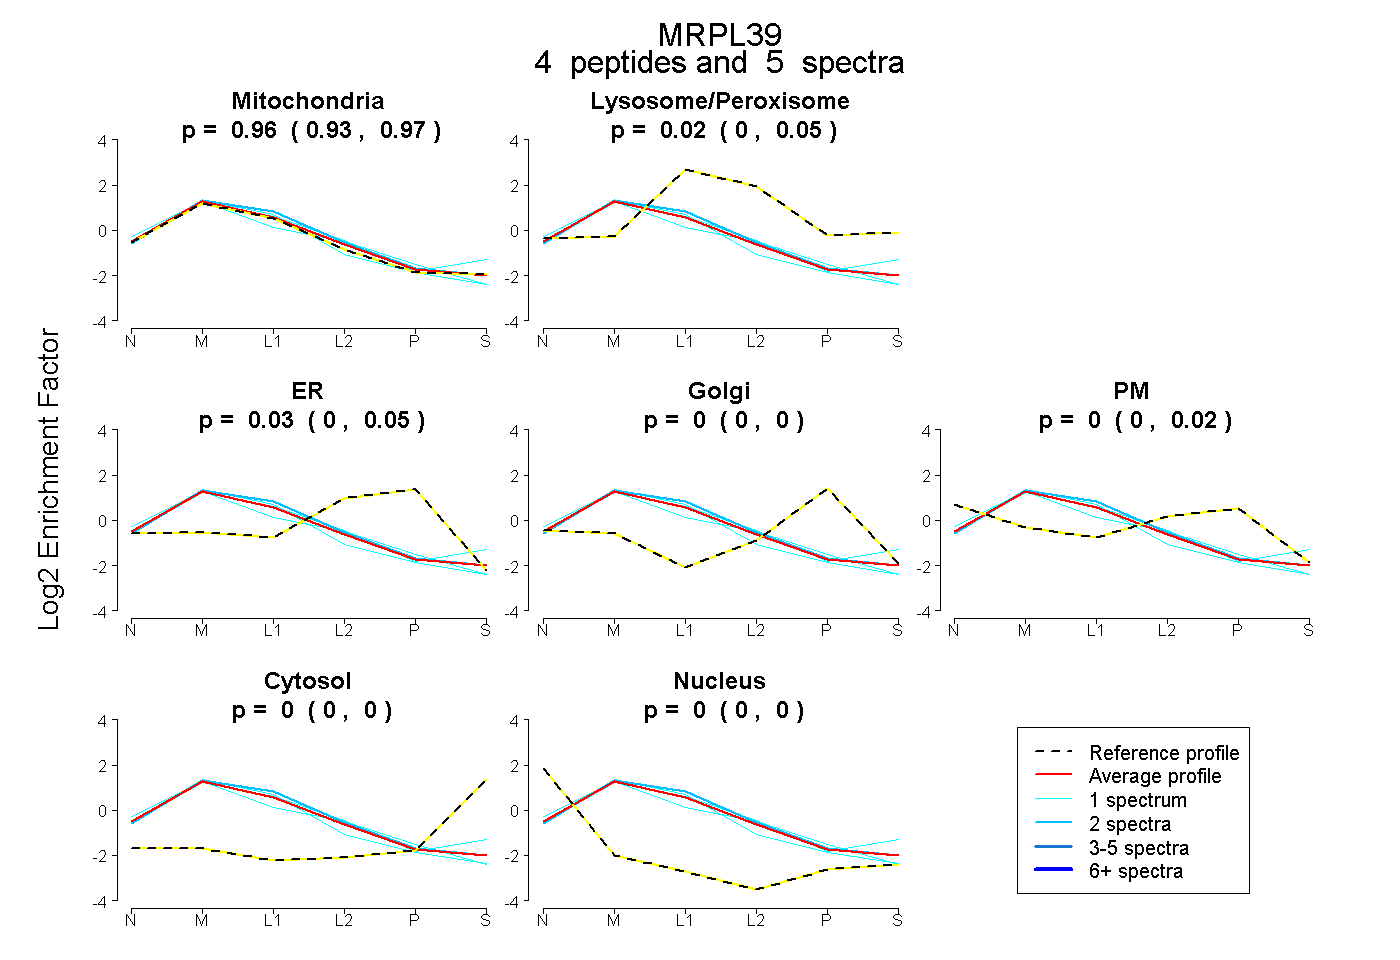
0.929 | 0.973
0.000 | 0.046
0.000 | 0.046
0.000 | 0.000
0.000 | 0.024
0.000 | 0.000
0.000 | 0.000
9peptides
spectra
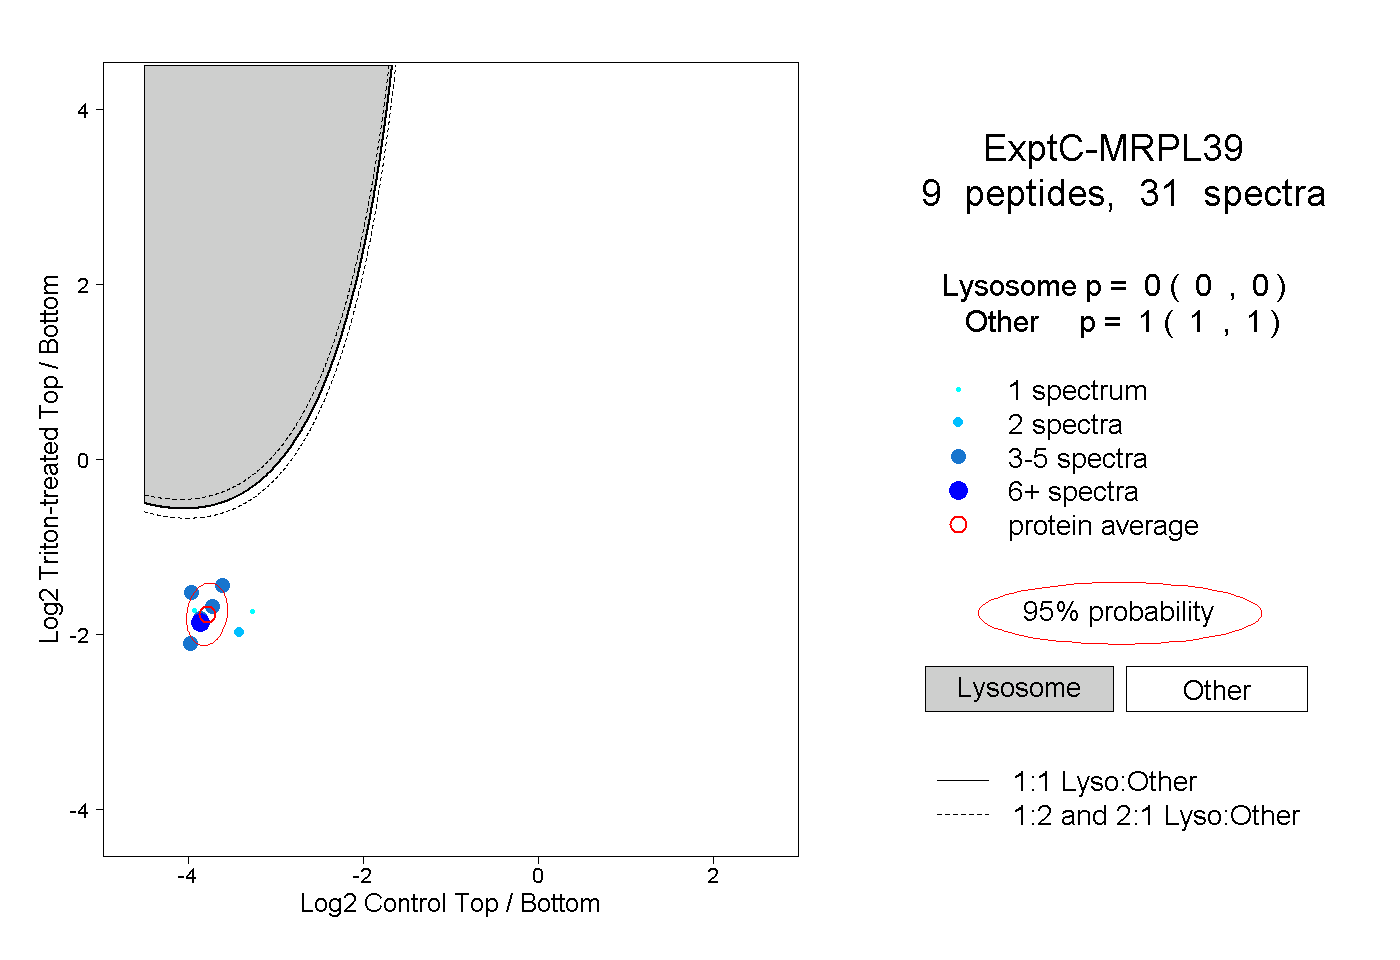
0.000 | 0.000
1.000 | 1.000
3peptides
spectra
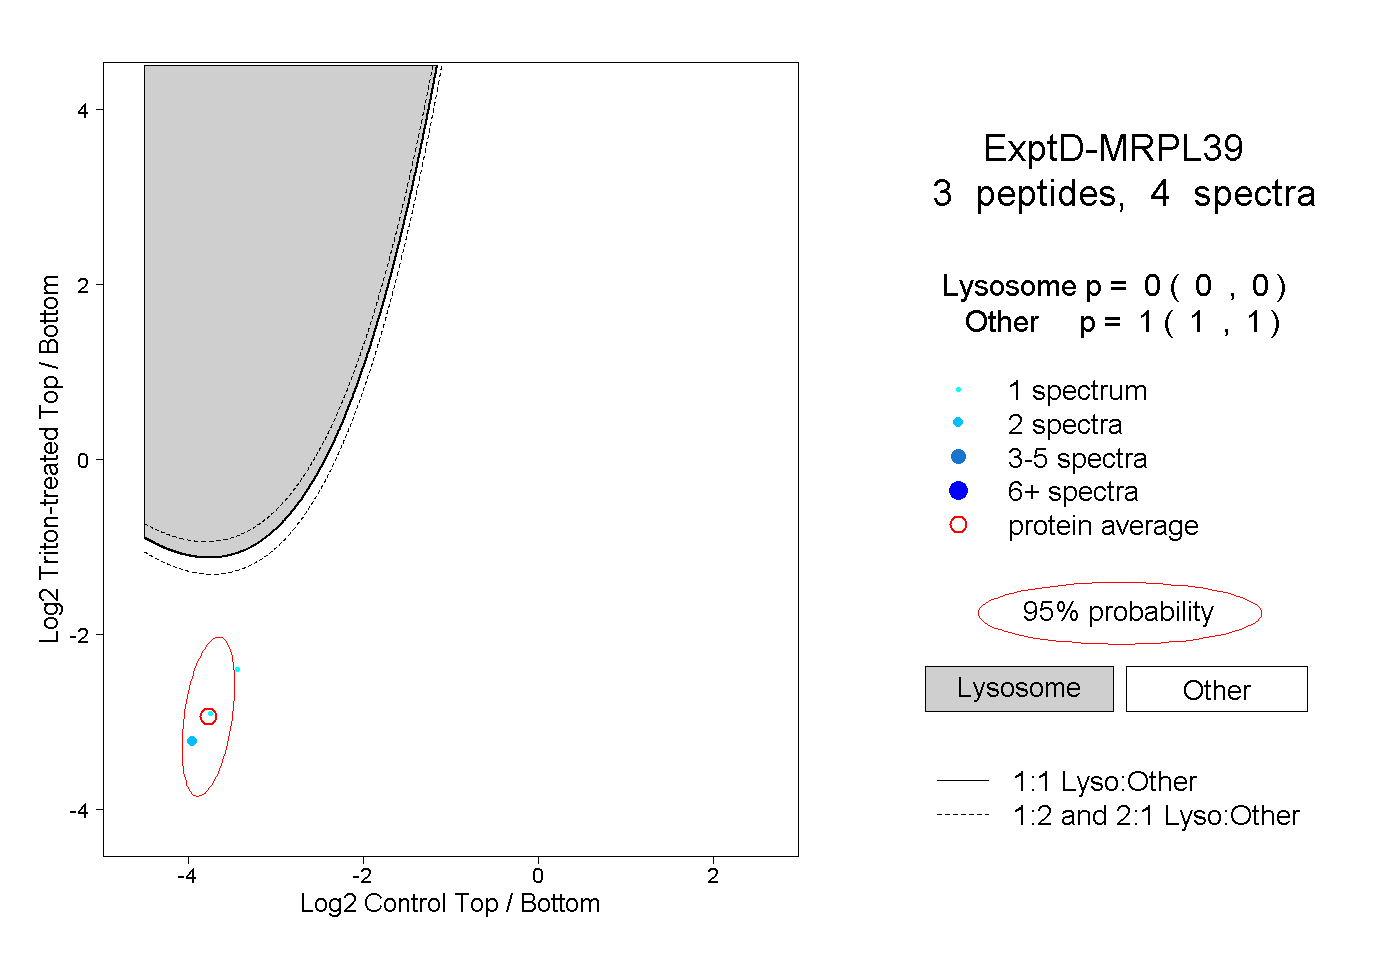
0.000 | 0.000
1.000 | 1.000