 8
8peptides
spectra
0.973 | 0.986
0.000 | 0.000
0.000 | 0.000
0.000 | 0.000
0.000 | 0.000
0.000 | 0.000
0.000 | 0.000
0.013 | 0.026
| Plot | Mito | Lyso | Perox | ER | Golgi | PM | Cytosol | Nucleus | |||||
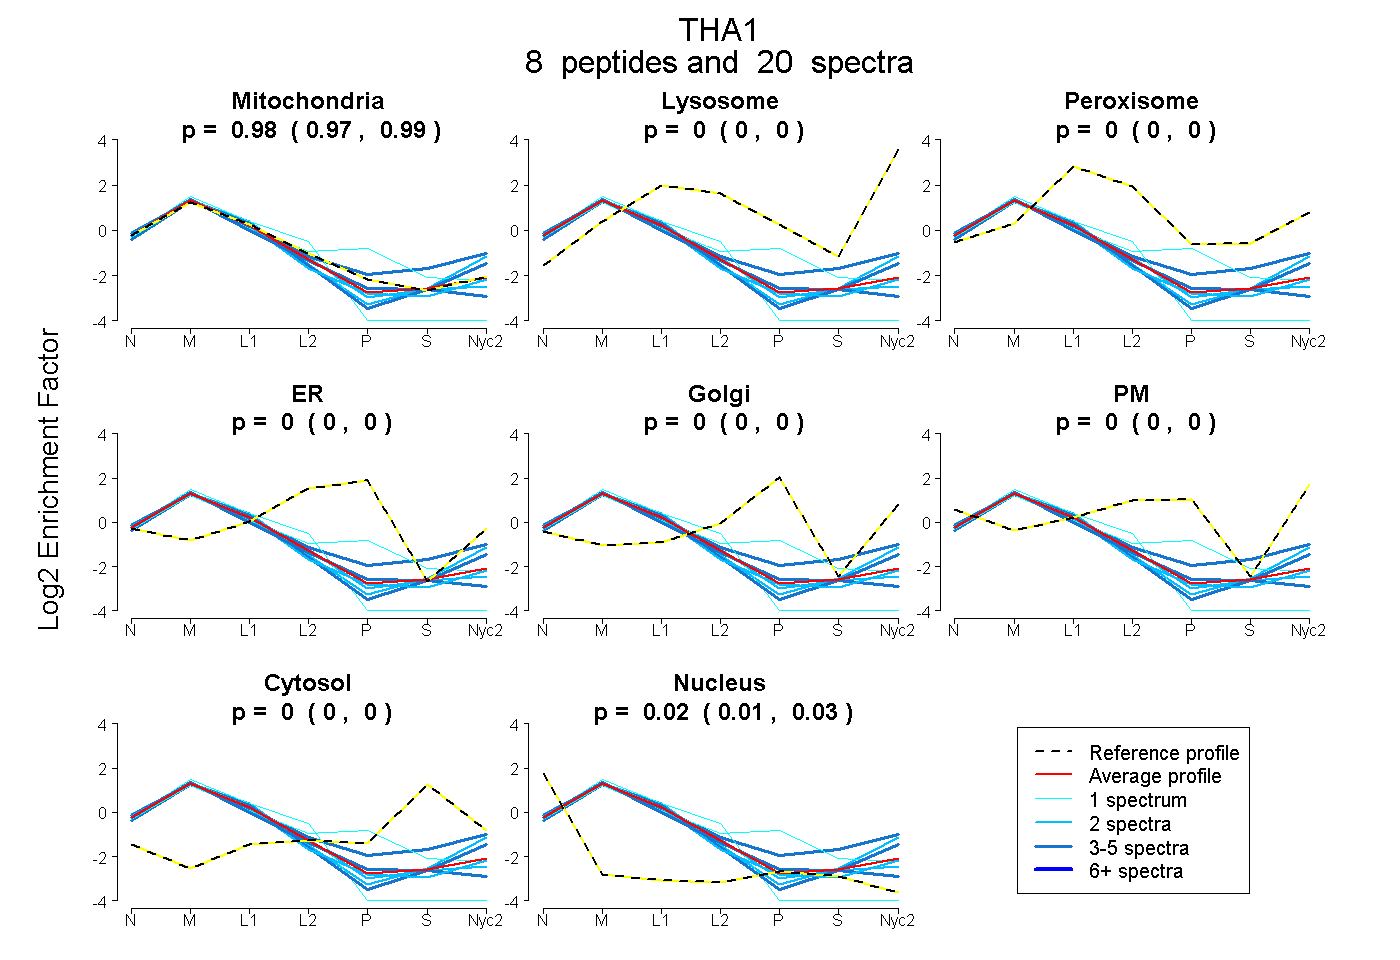
| Expt A |
8 peptides |
20 spectra |
|
0.980 0.973 | 0.986 |
0.000 0.000 | 0.000 |
0.000 0.000 | 0.000 |
0.000 0.000 | 0.000 |
0.000 0.000 | 0.000 |
0.000 0.000 | 0.000 |
0.000 0.000 | 0.000 |
0.020 0.013 | 0.026 |
| 4 spectra, VLLFPWTEQSVR | 0.924 | 0.000 | 0.000 | 0.000 | 0.000 | 0.000 | 0.000 | 0.076 | ||
| 1 spectrum, SDTVTRPGPAMR | 0.795 | 0.000 | 0.000 | 0.147 | 0.021 | 0.000 | 0.037 | 0.000 | ||
| 2 spectra, DFIEEAWR | 0.970 | 0.025 | 0.000 | 0.000 | 0.000 | 0.000 | 0.000 | 0.005 | ||
| 2 spectra, VLSIDYLR | 0.956 | 0.000 | 0.000 | 0.000 | 0.000 | 0.000 | 0.000 | 0.044 | ||
| 2 spectra, LLAHAHGAR | 0.956 | 0.000 | 0.000 | 0.000 | 0.000 | 0.000 | 0.000 | 0.044 | ||
| 1 spectrum, VAGLPPSELCQHLQAVSAEEVAQTGHAVR | 0.954 | 0.000 | 0.000 | 0.000 | 0.000 | 0.000 | 0.000 | 0.046 | ||
| 3 spectra, WEFVLR | 0.951 | 0.026 | 0.000 | 0.000 | 0.000 | 0.000 | 0.000 | 0.023 | ||
| 5 spectra, LMNAAVALR | 0.782 | 0.111 | 0.000 | 0.000 | 0.000 | 0.000 | 0.107 | 0.000 |
| Plot | Mito | Lyso or Perox | ER | Golgi | PM | Cytosol | Nucleus | ||||||
| Expt B |
6 peptides |
11 spectra |
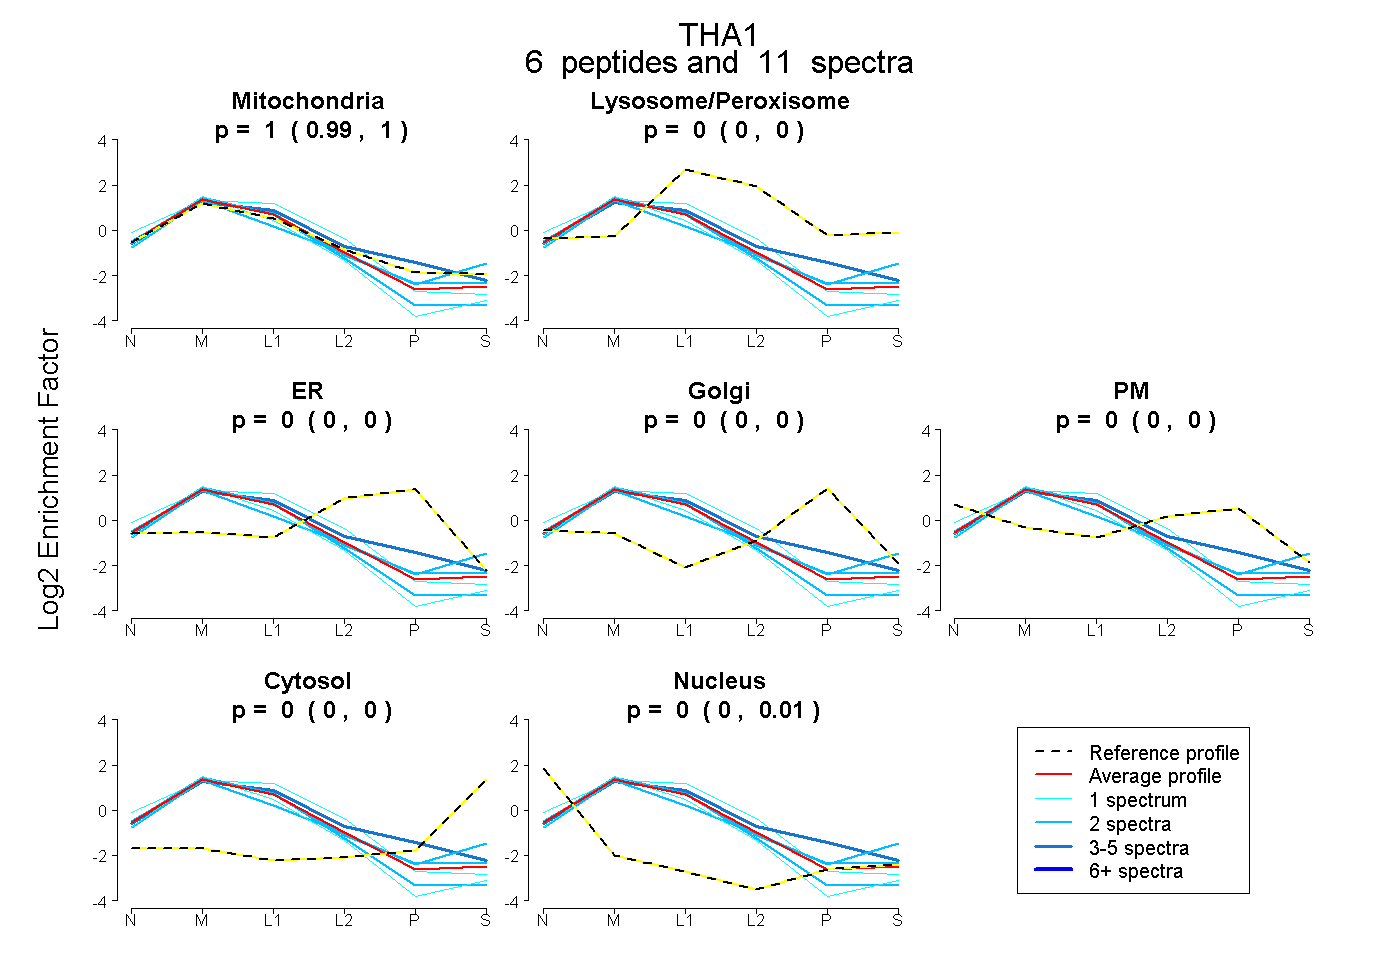 |
0.998 0.985 | 1.000 |
0.000 0.000 | 0.000 |
0.000 0.000 | 0.000 |
0.000 0.000 | 0.000 |
0.000 0.000 | 0.000 |
0.000 0.000 | 0.000 |
0.002 0.000 | 0.012 |
|||
| Plot | Lyso | Other | |||||||||||
| Expt C |
11 peptides |
43 spectra |
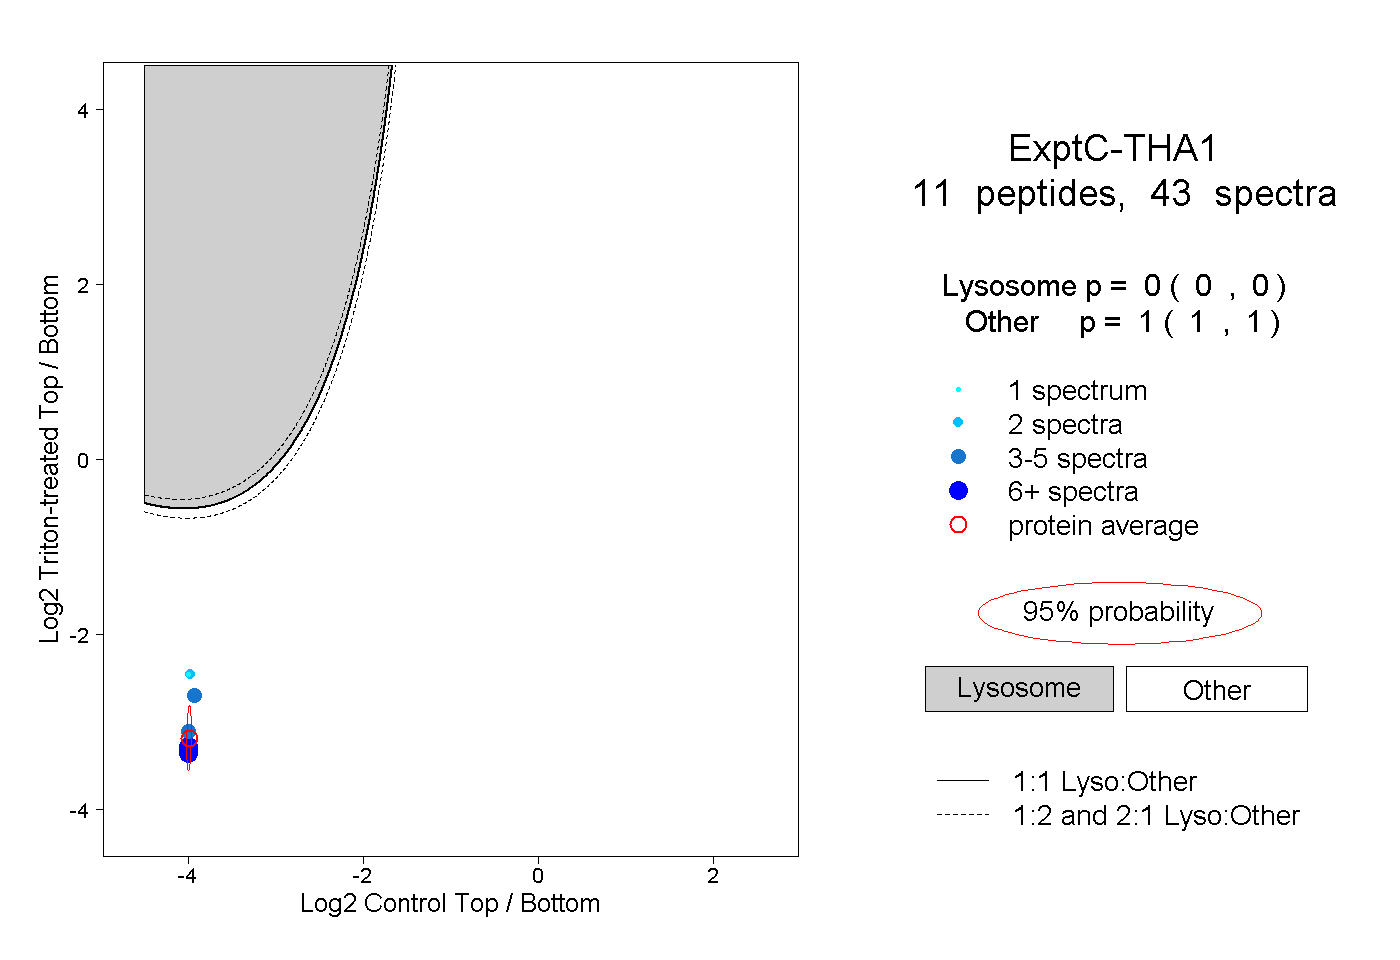 |
0.000 0.000 | 0.000 |
1.000 1.000 | 1.000 |
||||||||
| Plot | Lyso | Other | |||||||||||
| Expt D |
1 peptide |
1 spectrum |
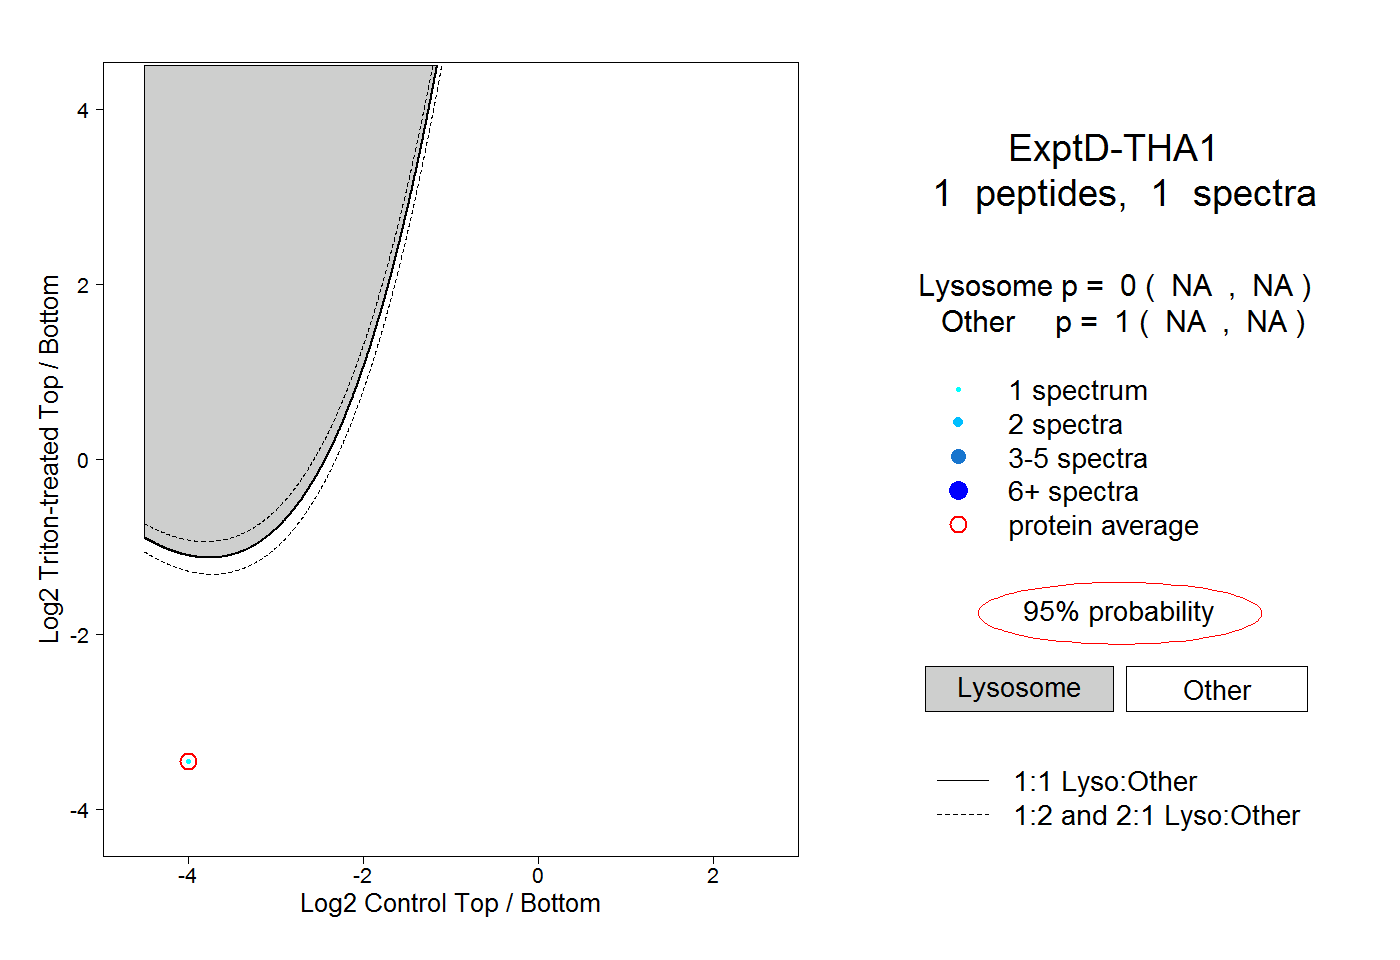 |
0.000 NA | NA |
1.000 NA | NA |