 24
24peptides
spectra
0.000 | 0.000
0.668 | 0.687
0.000 | 0.000
0.000 | 0.000
0.000 | 0.013
0.299 | 0.330
0.000 | 0.000
0.000 | 0.000
| Plot | Mito | Lyso | Perox | ER | Golgi | PM | Cytosol | Nucleus | |||||
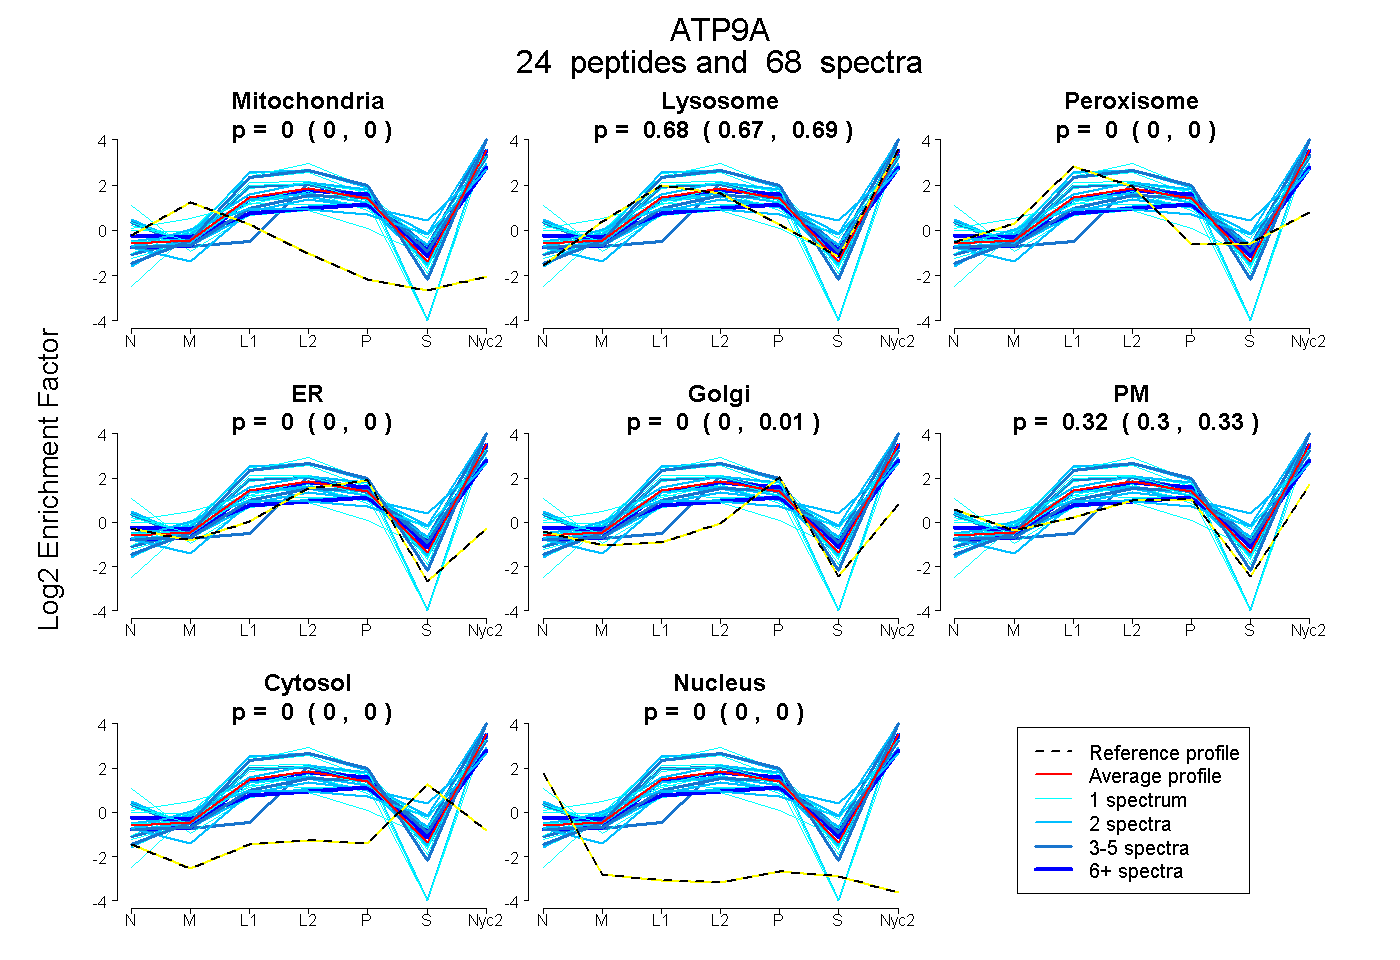
| Expt A |
24 peptides |
68 spectra |
|
0.000 0.000 | 0.000 |
0.677 0.668 | 0.687 |
0.000 0.000 | 0.000 |
0.000 0.000 | 0.000 |
0.000 0.000 | 0.013 |
0.323 0.299 | 0.330 |
0.000 0.000 | 0.000 |
0.000 0.000 | 0.000 |
| 2 spectra, GEAHLELNAFR | 0.000 | 0.358 | 0.000 | 0.000 | 0.000 | 0.642 | 0.000 | 0.000 | ||
| 2 spectra, SSTIPEQLGR | 0.000 | 0.879 | 0.000 | 0.000 | 0.088 | 0.006 | 0.027 | 0.000 | ||
| 1 spectrum, FSPPSYSK | 0.000 | 0.784 | 0.000 | 0.000 | 0.000 | 0.216 | 0.000 | 0.000 | ||
| 2 spectra, GPTVTTK | 0.000 | 0.656 | 0.009 | 0.000 | 0.000 | 0.285 | 0.049 | 0.000 | ||
| 3 spectra, CAPTQK | 0.000 | 0.262 | 0.000 | 0.000 | 0.000 | 0.738 | 0.000 | 0.000 | ||
| 2 spectra, TGTLTQNEMVFK | 0.000 | 0.657 | 0.000 | 0.000 | 0.016 | 0.160 | 0.167 | 0.000 | ||
| 7 spectra, SAALSQFVIHR | 0.000 | 0.493 | 0.000 | 0.000 | 0.109 | 0.337 | 0.061 | 0.000 | ||
| 2 spectra, MGIIVR | 0.000 | 0.899 | 0.000 | 0.000 | 0.101 | 0.000 | 0.000 | 0.000 | ||
| 1 spectrum, VHEAVK | 0.000 | 0.702 | 0.000 | 0.000 | 0.000 | 0.255 | 0.042 | 0.000 | ||
| 5 spectra, TDQLDGETDWK | 0.000 | 0.680 | 0.000 | 0.000 | 0.276 | 0.044 | 0.000 | 0.000 | ||
| 1 spectrum, NGSCFLR | 0.000 | 0.602 | 0.001 | 0.000 | 0.000 | 0.390 | 0.007 | 0.000 | ||
| 21 spectra, LLMVHGR | 0.000 | 0.727 | 0.000 | 0.000 | 0.146 | 0.127 | 0.000 | 0.000 | ||
| 1 spectrum, SLTEEQYQDFEAR | 0.000 | 0.673 | 0.000 | 0.000 | 0.000 | 0.327 | 0.000 | 0.000 | ||
| 1 spectrum, QASLAADFSITQFK | 0.000 | 0.744 | 0.000 | 0.126 | 0.000 | 0.130 | 0.000 | 0.000 | ||
| 2 spectra, LPVACTQR | 0.000 | 0.678 | 0.000 | 0.033 | 0.000 | 0.289 | 0.000 | 0.000 | ||
| 1 spectrum, NQDIHVFR | 0.000 | 0.338 | 0.000 | 0.000 | 0.000 | 0.662 | 0.000 | 0.000 | ||
| 3 spectra, VPADMIFLR | 0.000 | 0.886 | 0.000 | 0.114 | 0.000 | 0.000 | 0.000 | 0.000 | ||
| 1 spectrum, IPGTVVR | 0.000 | 0.477 | 0.000 | 0.000 | 0.000 | 0.523 | 0.000 | 0.000 | ||
| 1 spectrum, EAVEEIR | 0.000 | 0.944 | 0.000 | 0.056 | 0.000 | 0.000 | 0.000 | 0.000 | ||
| 1 spectrum, LPTAADLLQIR | 0.000 | 0.981 | 0.000 | 0.019 | 0.000 | 0.000 | 0.000 | 0.000 | ||
| 4 spectra, EMNSQIYSR | 0.000 | 0.947 | 0.000 | 0.000 | 0.053 | 0.000 | 0.000 | 0.000 | ||
| 1 spectrum, DQSSMQLR | 0.000 | 0.926 | 0.000 | 0.000 | 0.074 | 0.000 | 0.000 | 0.000 | ||
| 2 spectra, QFEDSCR | 0.000 | 0.662 | 0.000 | 0.000 | 0.076 | 0.027 | 0.236 | 0.000 | ||
| 1 spectrum, ISYLLTDK | 0.000 | 0.310 | 0.000 | 0.000 | 0.000 | 0.621 | 0.069 | 0.000 |
| Plot | Mito | Lyso or Perox | ER | Golgi | PM | Cytosol | Nucleus | ||||||
| Expt B |
7 peptides |
13 spectra |
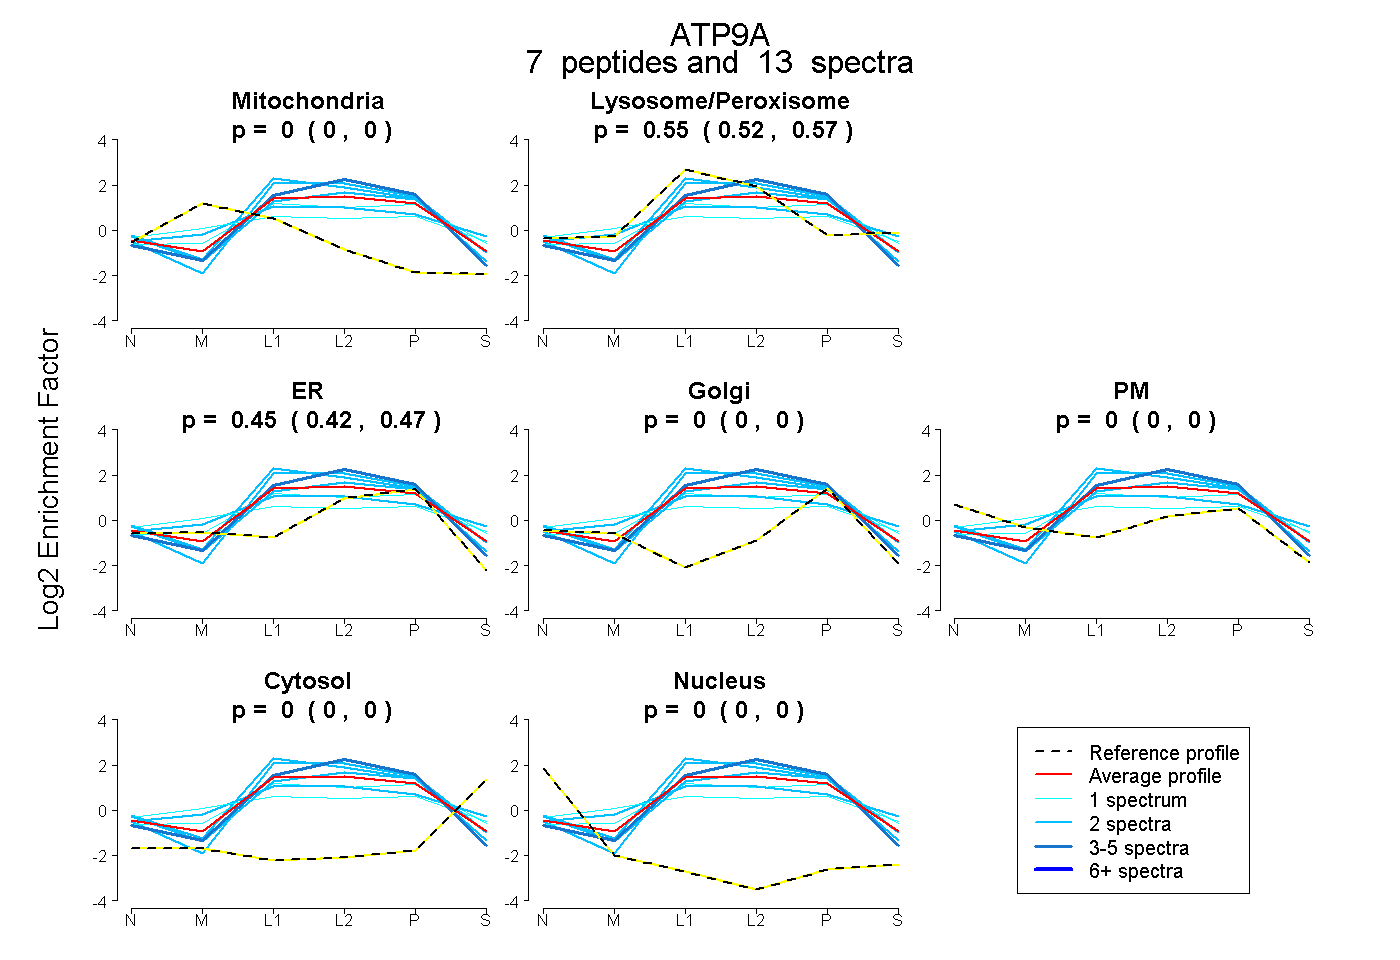 |
0.000 0.000 | 0.000 |
0.549 0.525 | 0.569 |
0.451 0.424 | 0.472 |
0.000 0.000 | 0.000 |
0.000 0.000 | 0.000 |
0.000 0.000 | 0.000 |
0.000 0.000 | 0.000 |
|||
| Plot | Lyso | Other | |||||||||||
| Expt C |
34 peptides |
180 spectra |
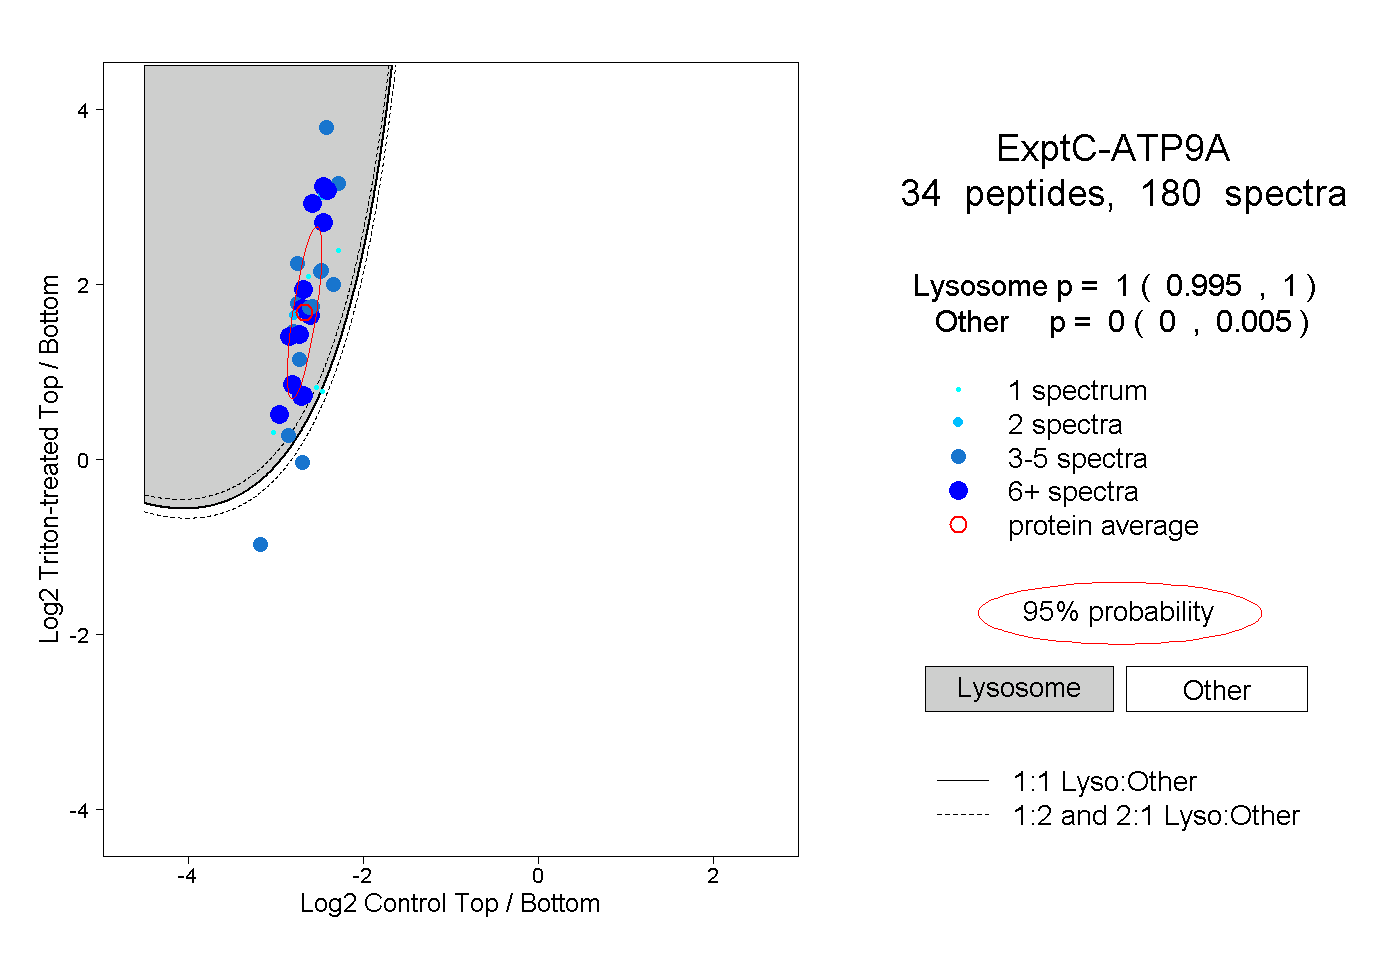 |
1.000 0.995 | 1.000 |
0.000 0.000 | 0.005 |
||||||||
| Plot | Lyso | Other | |||||||||||
| Expt D |
7 peptides |
12 spectra |
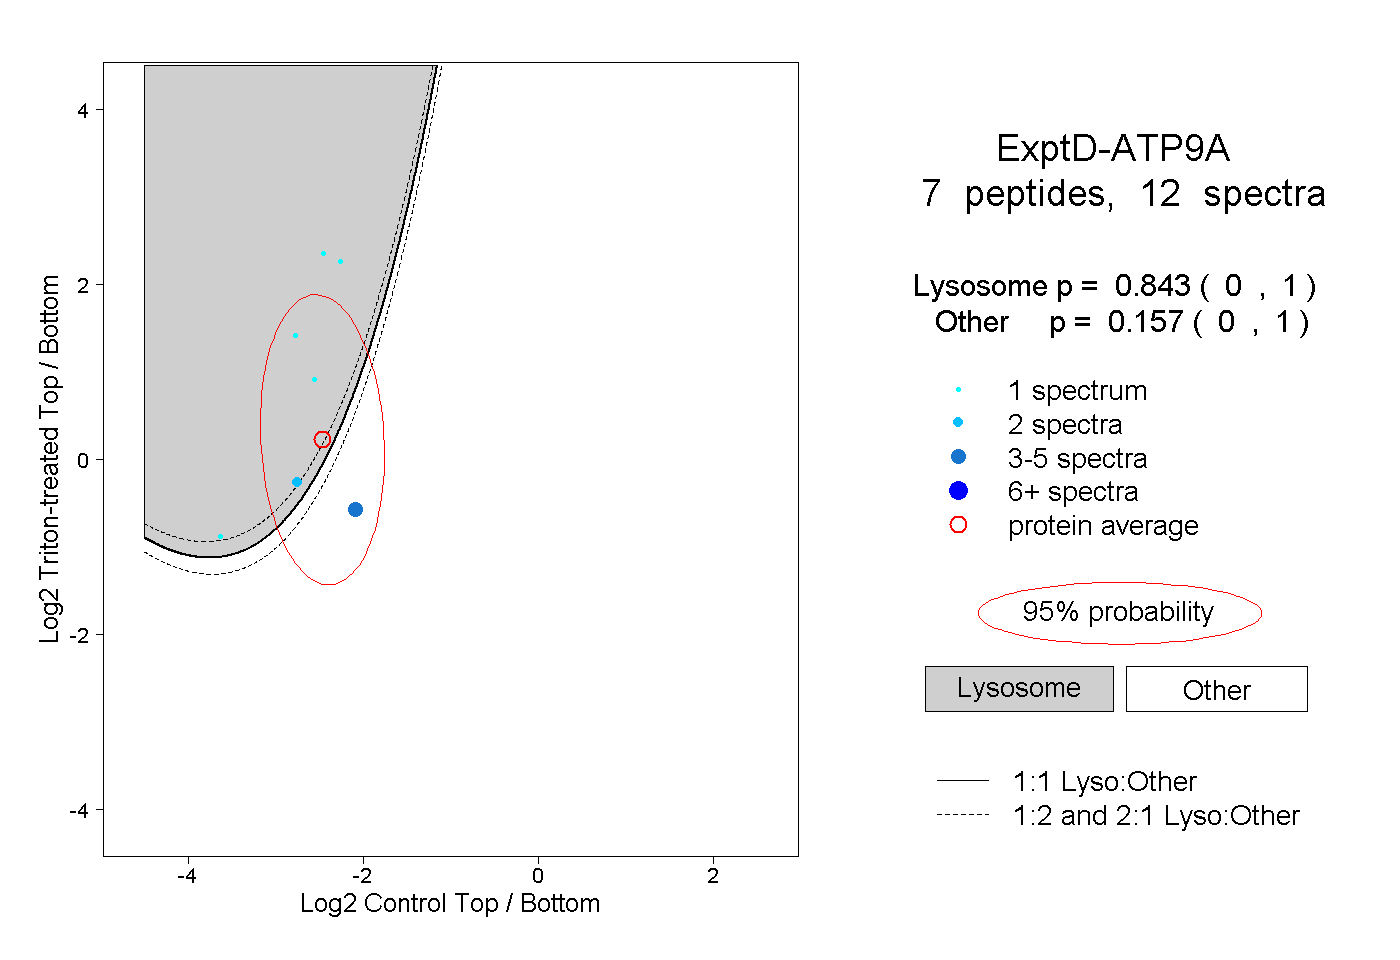 |
0.843 0.000 | 1.000 |
0.157 0.000 | 1.000 |