 24
24peptides
spectra
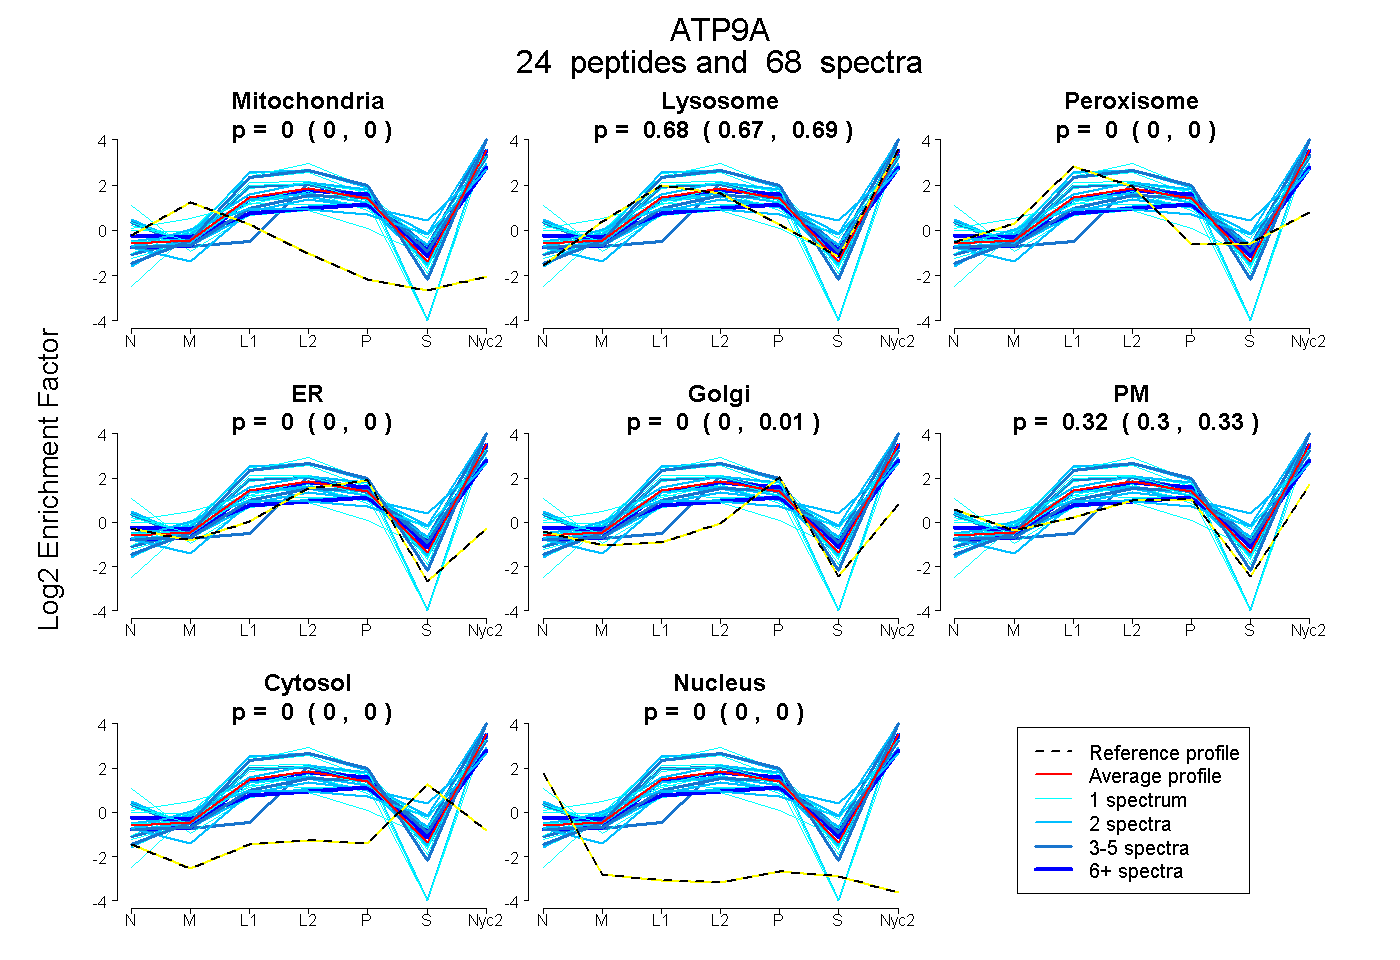
0.000 | 0.000
0.668 | 0.687
0.000 | 0.000
0.000 | 0.000
0.000 | 0.013
0.299 | 0.330
0.000 | 0.000
0.000 | 0.000
7peptides
spectra
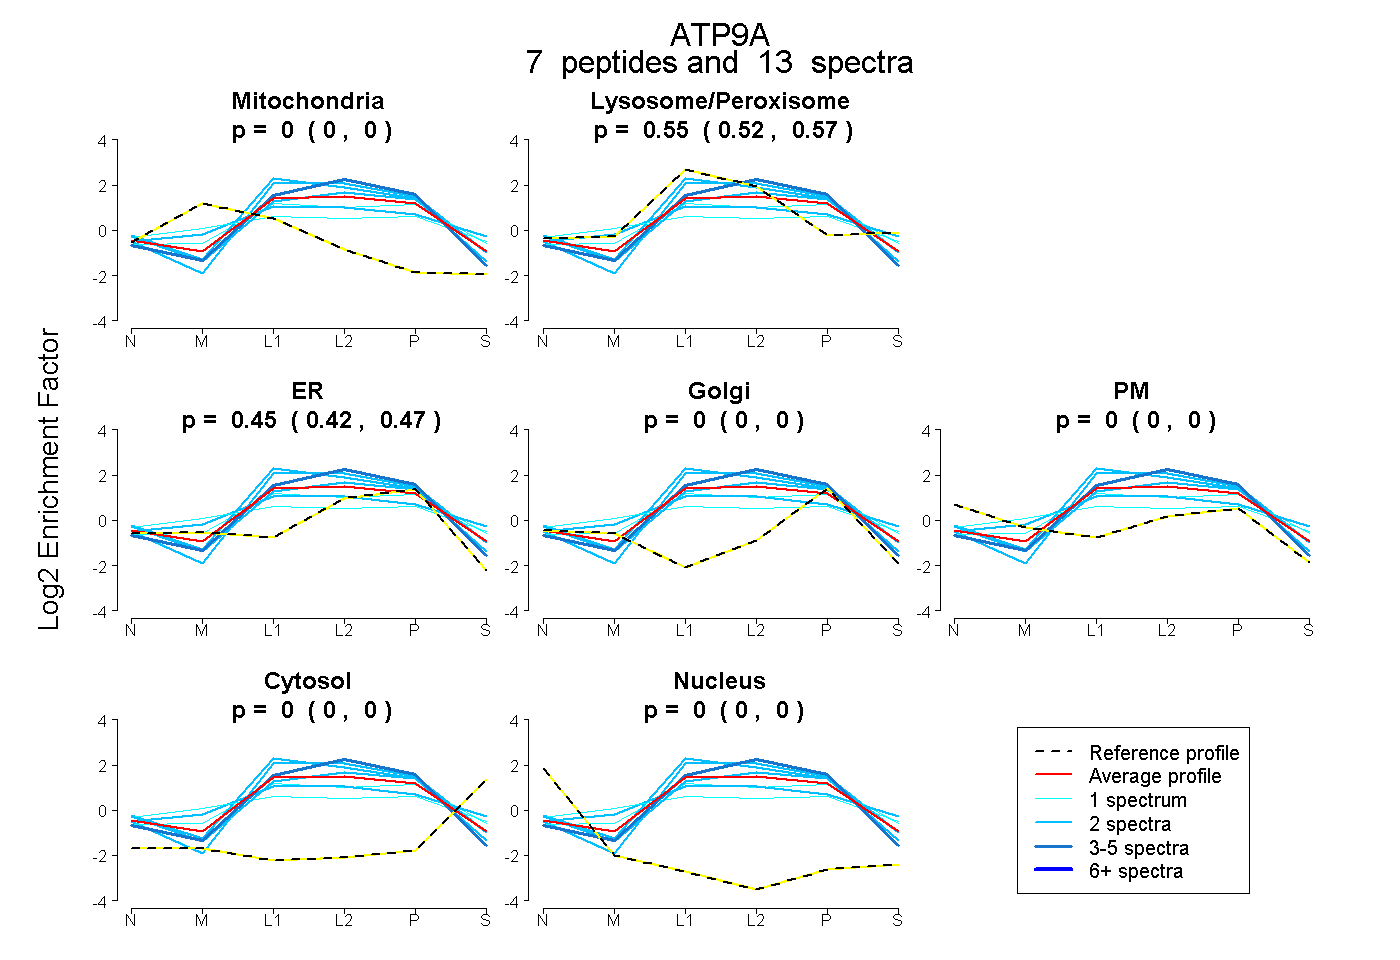
0.000 | 0.000
0.525 | 0.569
0.424 | 0.472
0.000 | 0.000
0.000 | 0.000
0.000 | 0.000
0.000 | 0.000
34peptides
spectra
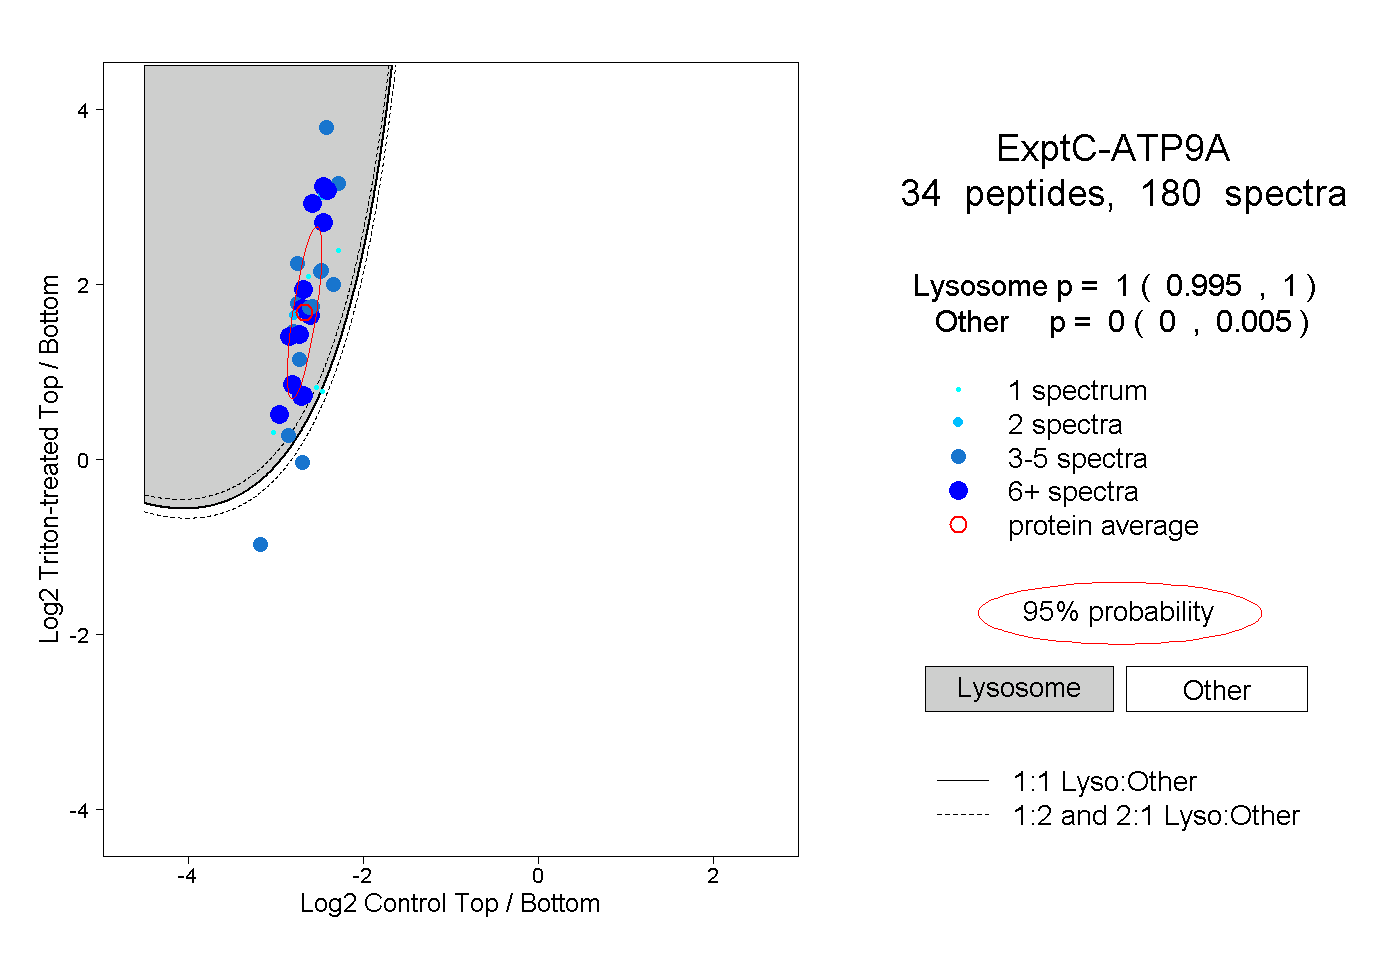
0.995 | 1.000
0.000 | 0.005
7peptides
spectra
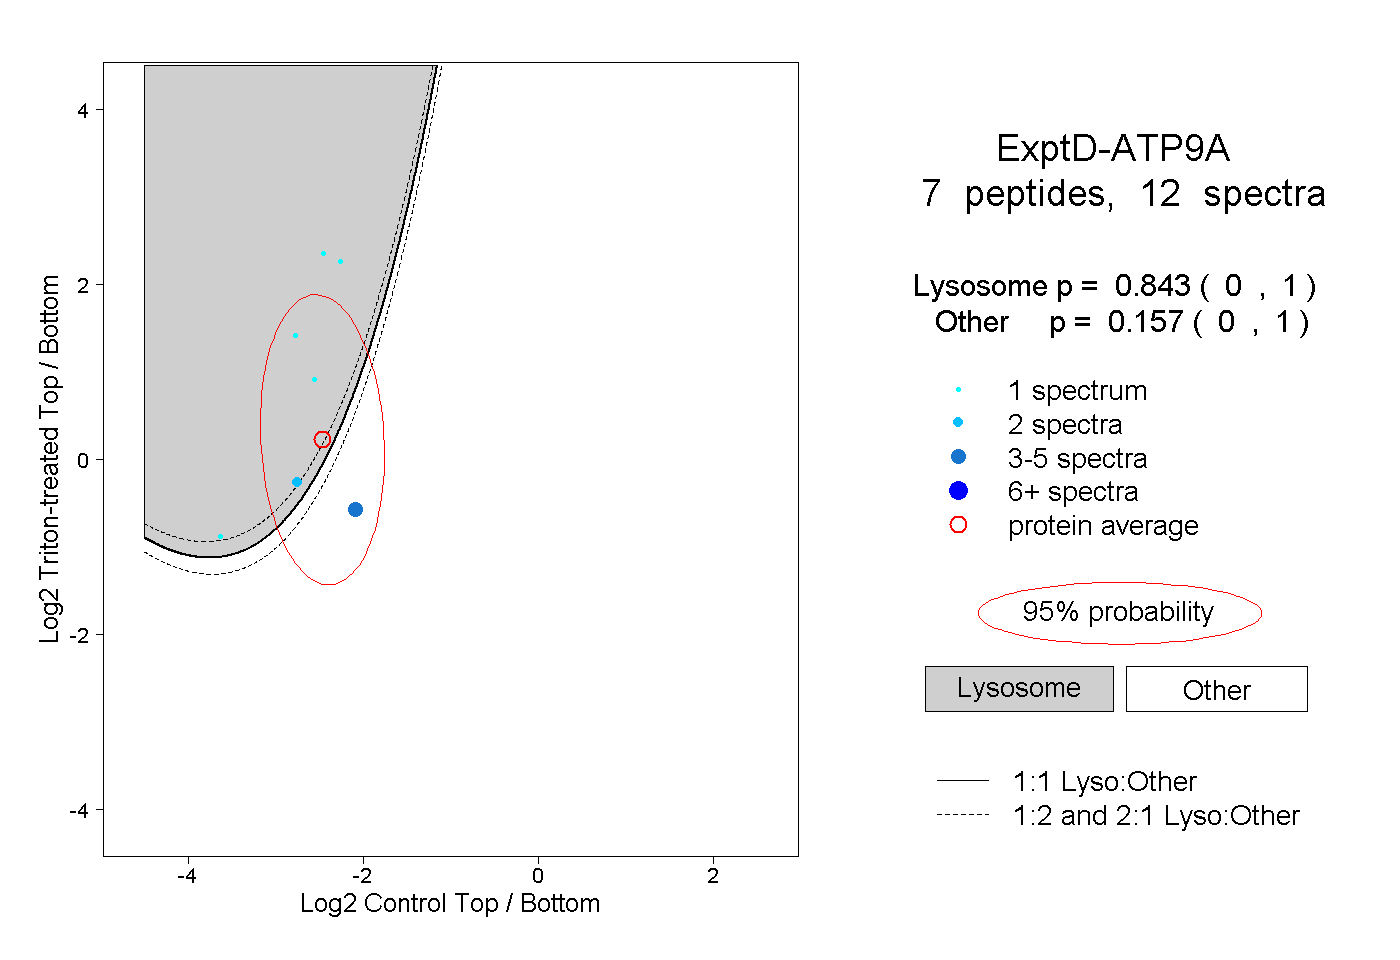
0.000 | 1.000
0.000 | 1.000