 3
3peptides
spectra
0.000 | 0.000
0.000 | 0.000
0.000 | 0.000
0.000 | 0.166
0.088 | 0.327
0.000 | 0.000
0.648 | 0.755
0.000 | 0.000
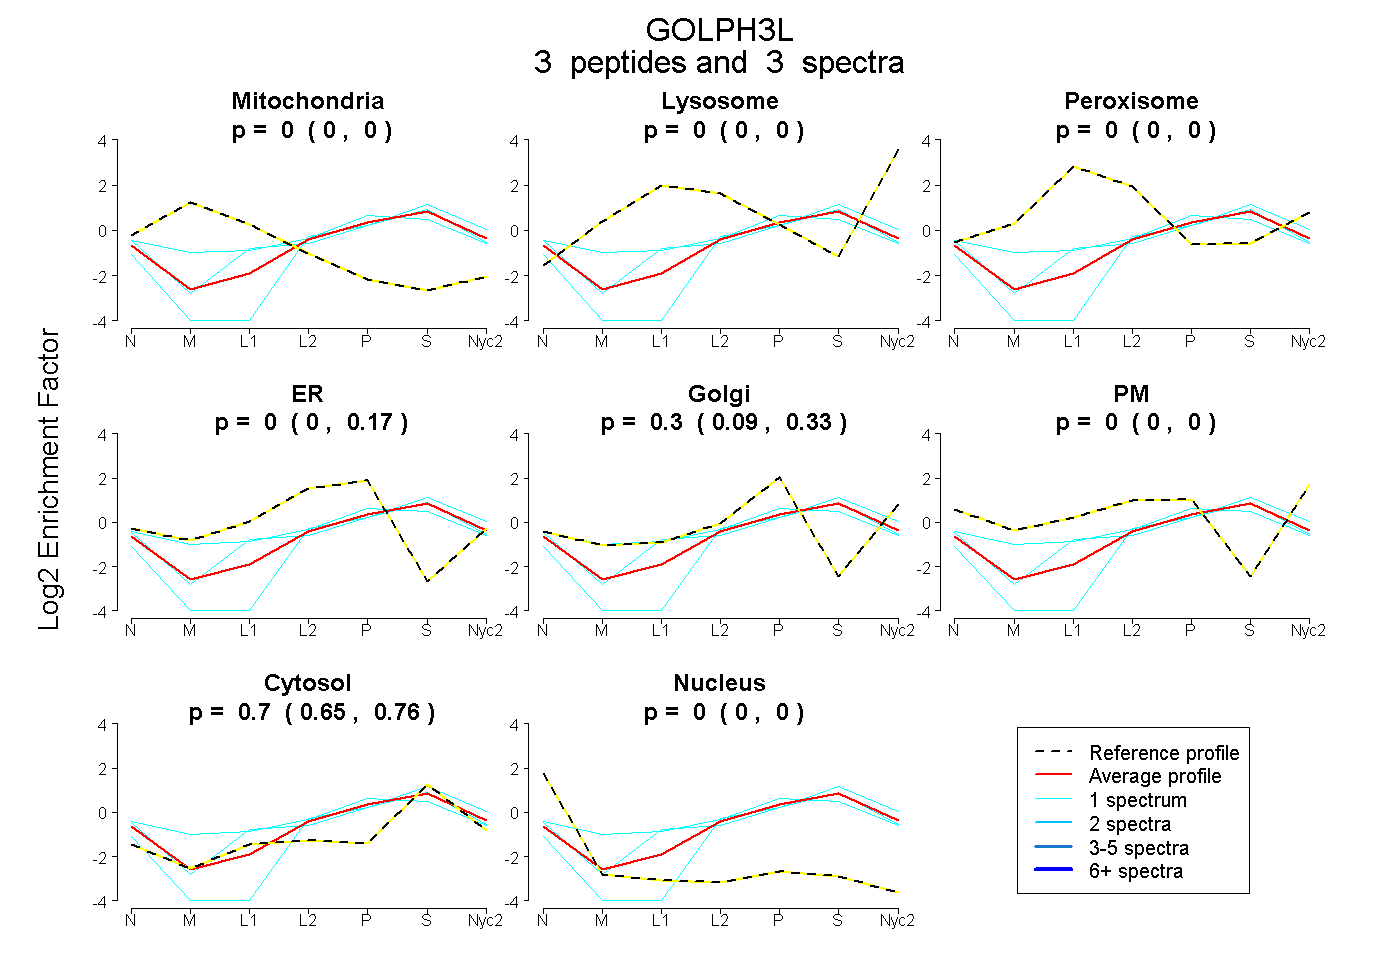
| Plot | Mito | Lyso | Perox | ER | Golgi | PM | Cytosol | Nucleus | |||||
| Expt A |
3 peptides |
3 spectra |
|
0.000 0.000 | 0.000 |
0.000 0.000 | 0.000 |
0.000 0.000 | 0.000 |
0.000 0.000 | 0.166 |
0.296 0.088 | 0.327 |
0.000 0.000 | 0.000 |
0.704 0.648 | 0.755 |
0.000 0.000 | 0.000 |
| 1 spectrum, SDSPTGDVLLDETLK | 0.000 | 0.000 | 0.000 | 0.000 | 0.162 | 0.000 | 0.838 | 0.000 | ||
| 1 spectrum, TTLTHR | 0.000 | 0.000 | 0.000 | 0.193 | 0.070 | 0.000 | 0.737 | 0.000 | ||
| 1 spectrum, DLVELDPEVEGTK | 0.000 | 0.000 | 0.072 | 0.196 | 0.196 | 0.000 | 0.536 | 0.000 |