 4
4peptides
spectra
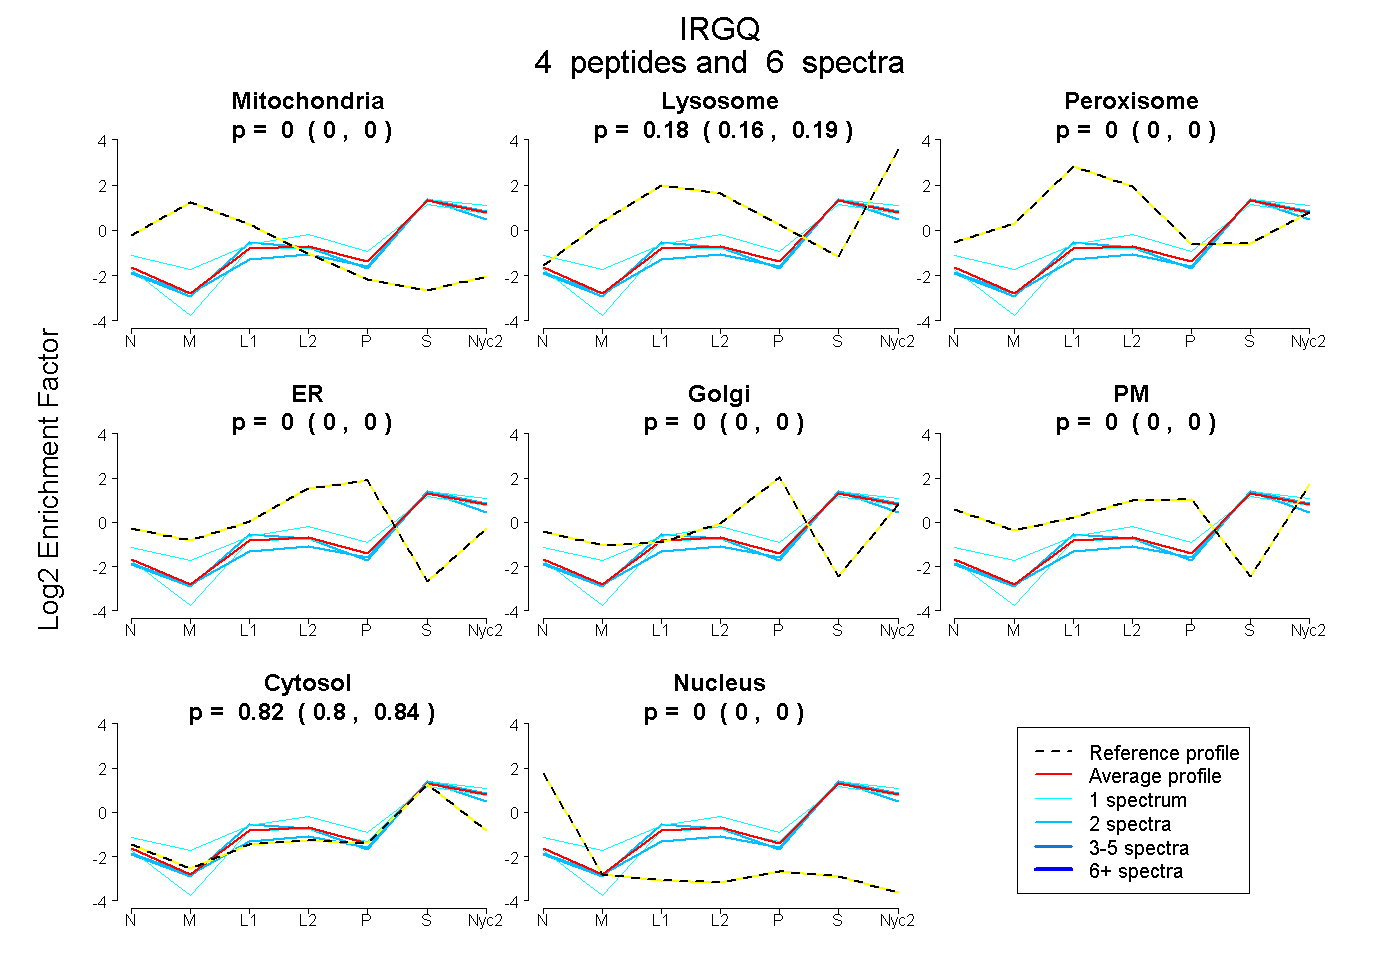
0.000 | 0.000
0.155 | 0.195
0.000 | 0.000
0.000 | 0.000
0.000 | 0.000
0.000 | 0.000
0.802 | 0.842
0.000 | 0.000
| Plot | Mito | Lyso | Perox | ER | Golgi | PM | Cytosol | Nucleus | |||||
| Expt A |
4 peptides |
6 spectra |
|
0.000 0.000 | 0.000 |
0.177 0.155 | 0.195 |
0.000 0.000 | 0.000 |
0.000 0.000 | 0.000 |
0.000 0.000 | 0.000 |
0.000 0.000 | 0.000 |
0.823 0.802 | 0.842 |
0.000 0.000 | 0.000 |
| 1 spectrum, TQAEALQR | 0.000 | 0.290 | 0.000 | 0.000 | 0.000 | 0.000 | 0.710 | 0.000 | ||
| 2 spectra, LQVVLR | 0.000 | 0.096 | 0.000 | 0.000 | 0.000 | 0.000 | 0.904 | 0.000 | ||
| 2 spectra, ALGIEPAAVAR | 0.000 | 0.178 | 0.000 | 0.000 | 0.000 | 0.000 | 0.822 | 0.000 | ||
| 1 spectrum, ALGLAPGVLATR | 0.000 | 0.146 | 0.000 | 0.000 | 0.000 | 0.000 | 0.854 | 0.000 |
| Plot | Lyso | Other | |||||||||||
| Expt C |
2 peptides |
2 spectra |
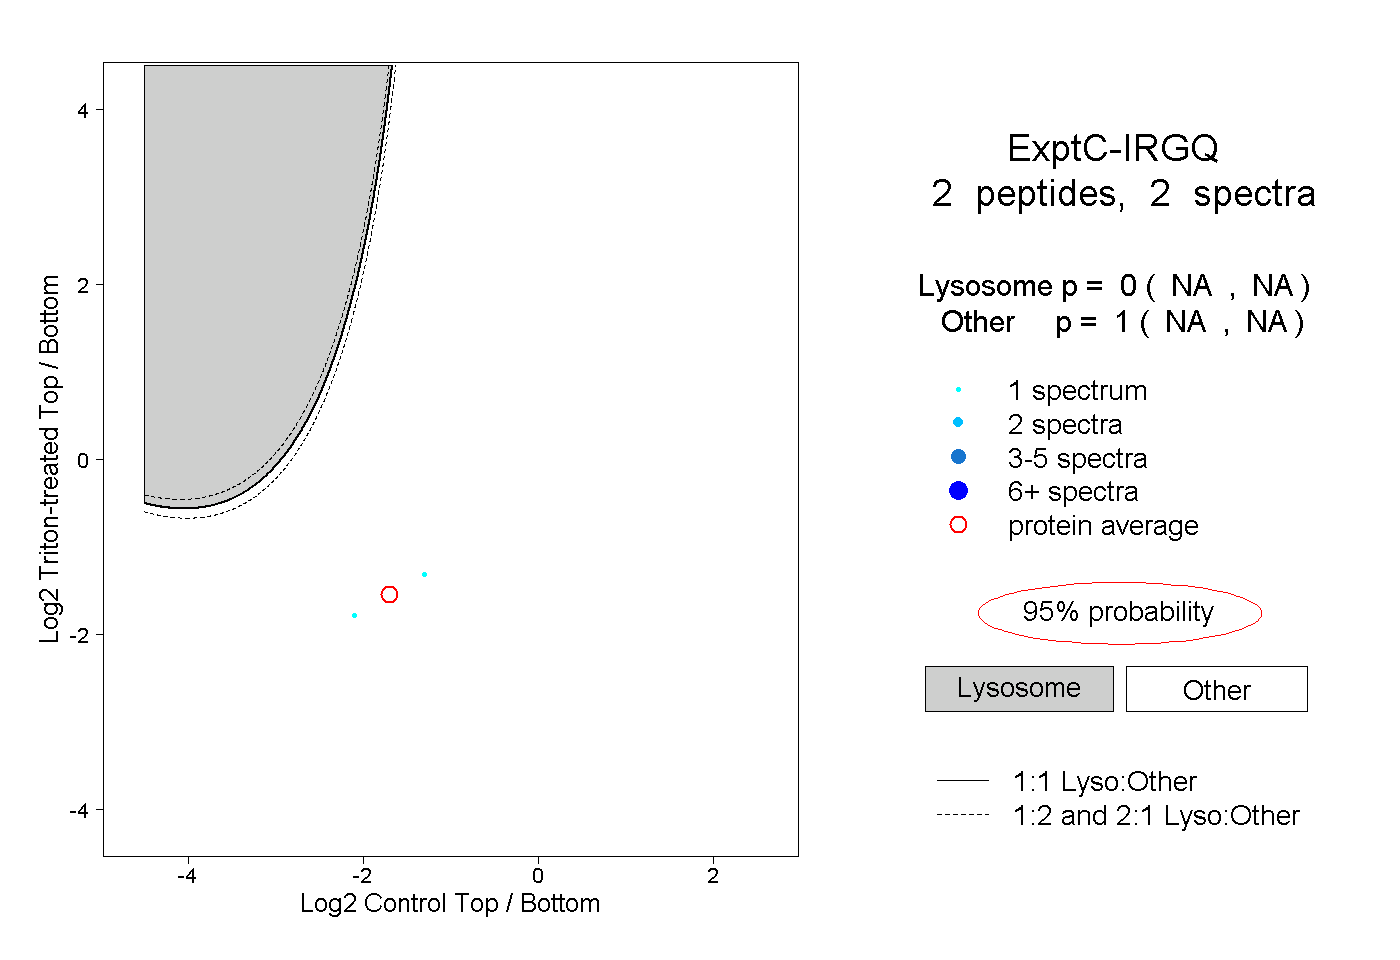 |
0.000 NA | NA |
1.000 NA | NA |