 4
4peptides
spectra
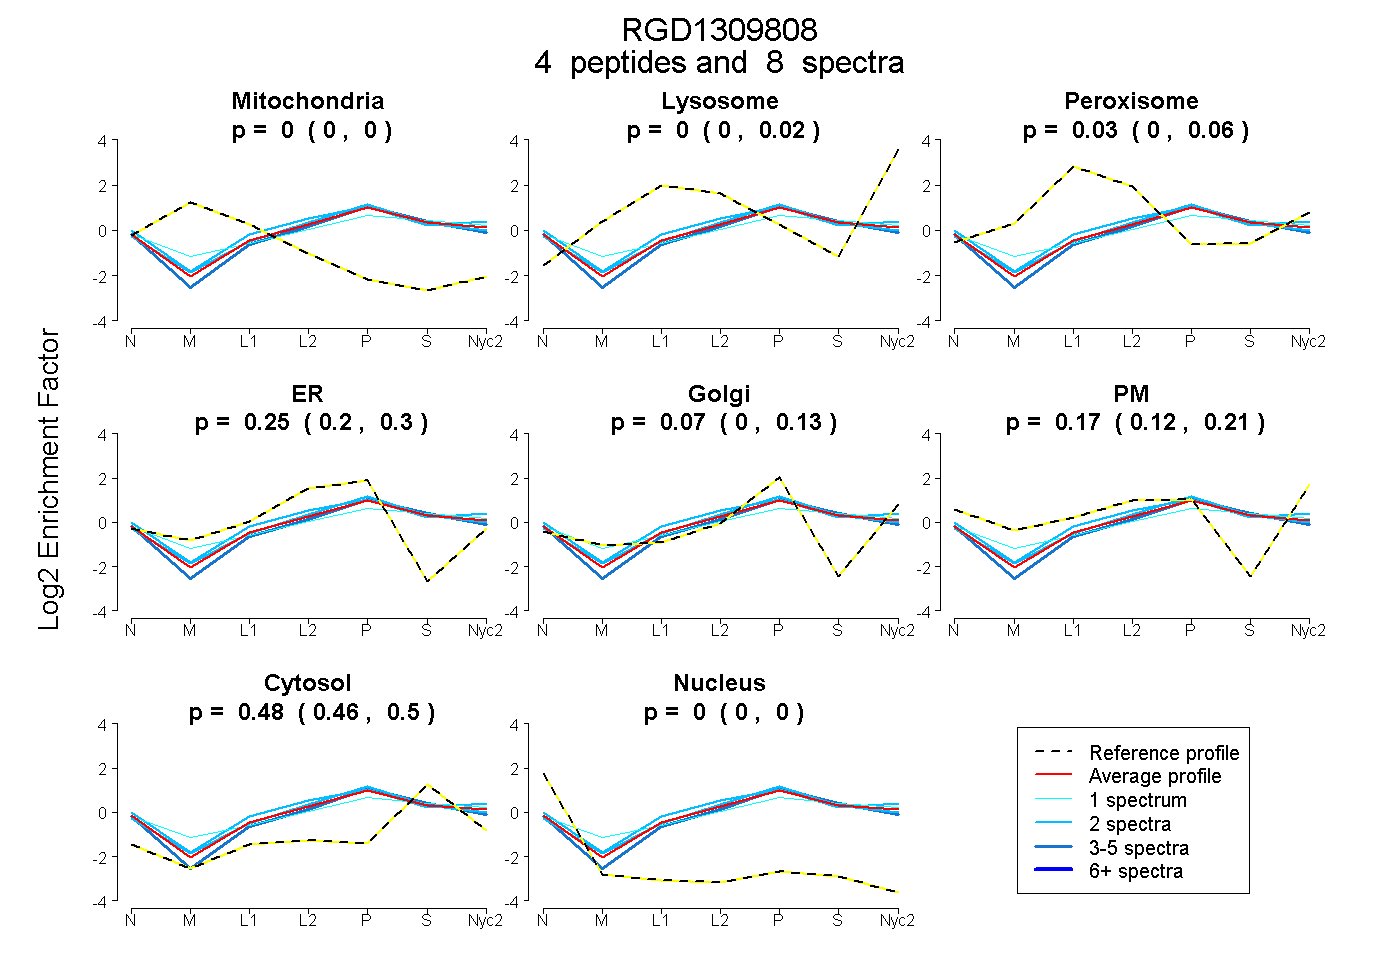
0.000 | 0.000
0.000 | 0.016
0.000 | 0.055
0.198 | 0.297
0.004 | 0.130
0.121 | 0.207
0.461 | 0.502
0.000 | 0.000
2peptides
spectra
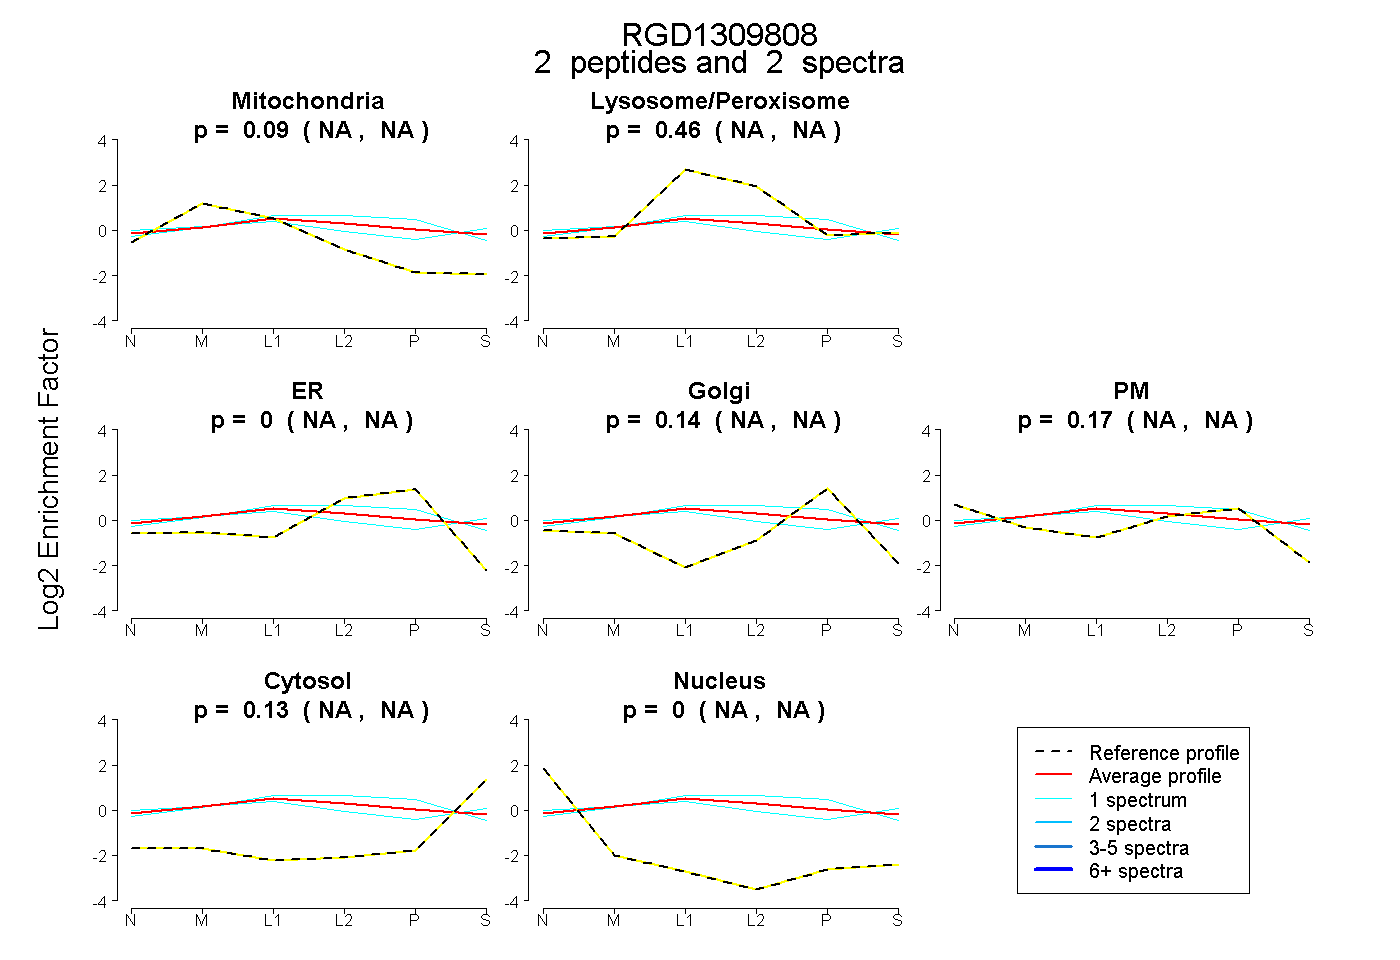
NA | NA
NA | NA
NA | NA
NA | NA
NA | NA
NA | NA
NA | NA
5peptides
spectra
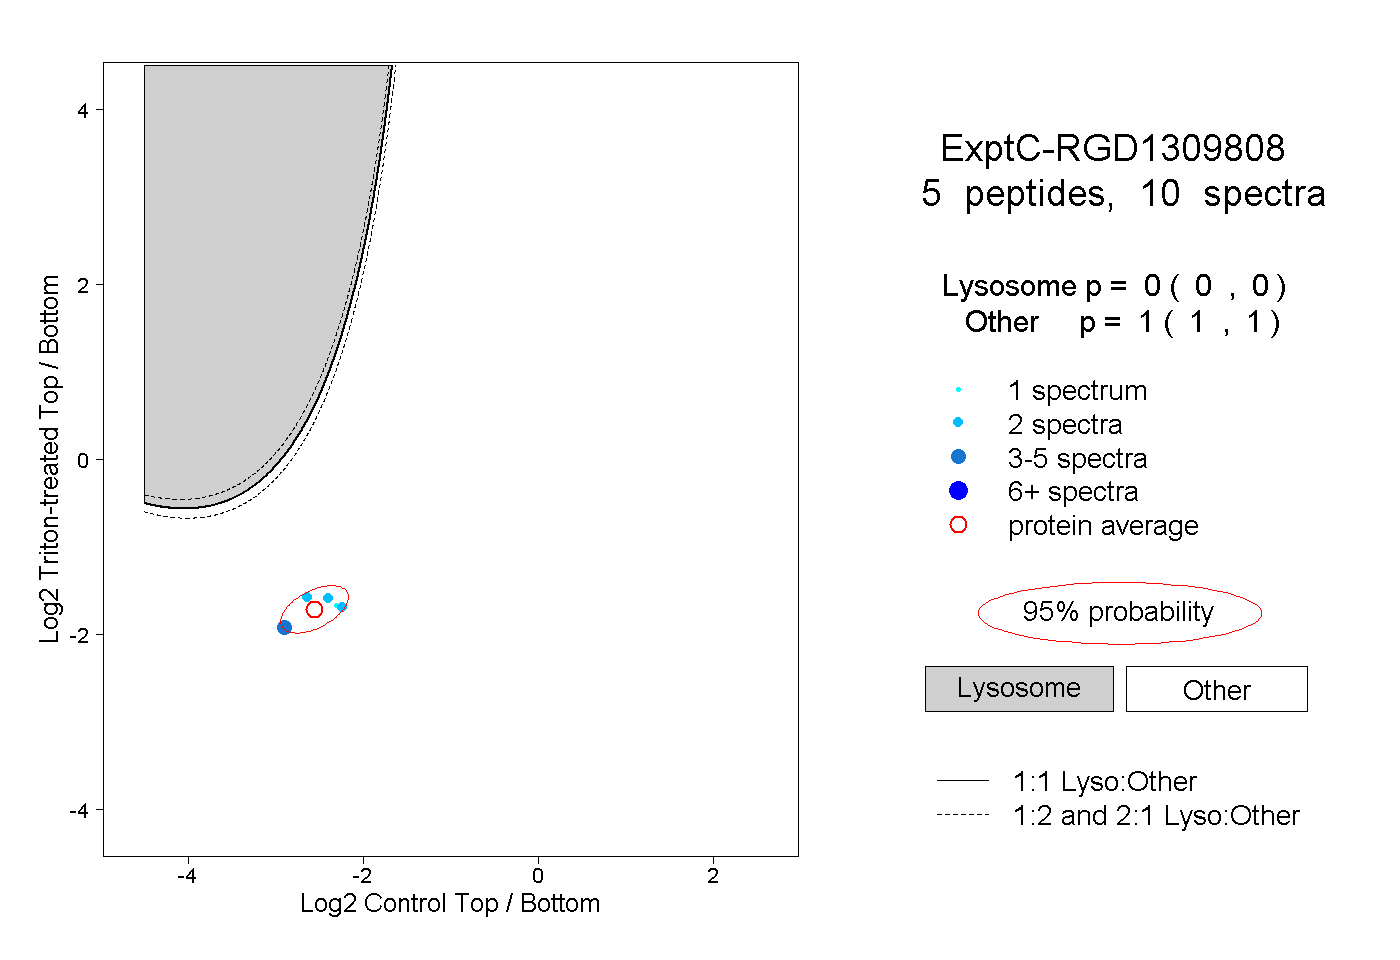
0.000 | 0.000
1.000 | 1.000