 3
3peptides
spectra
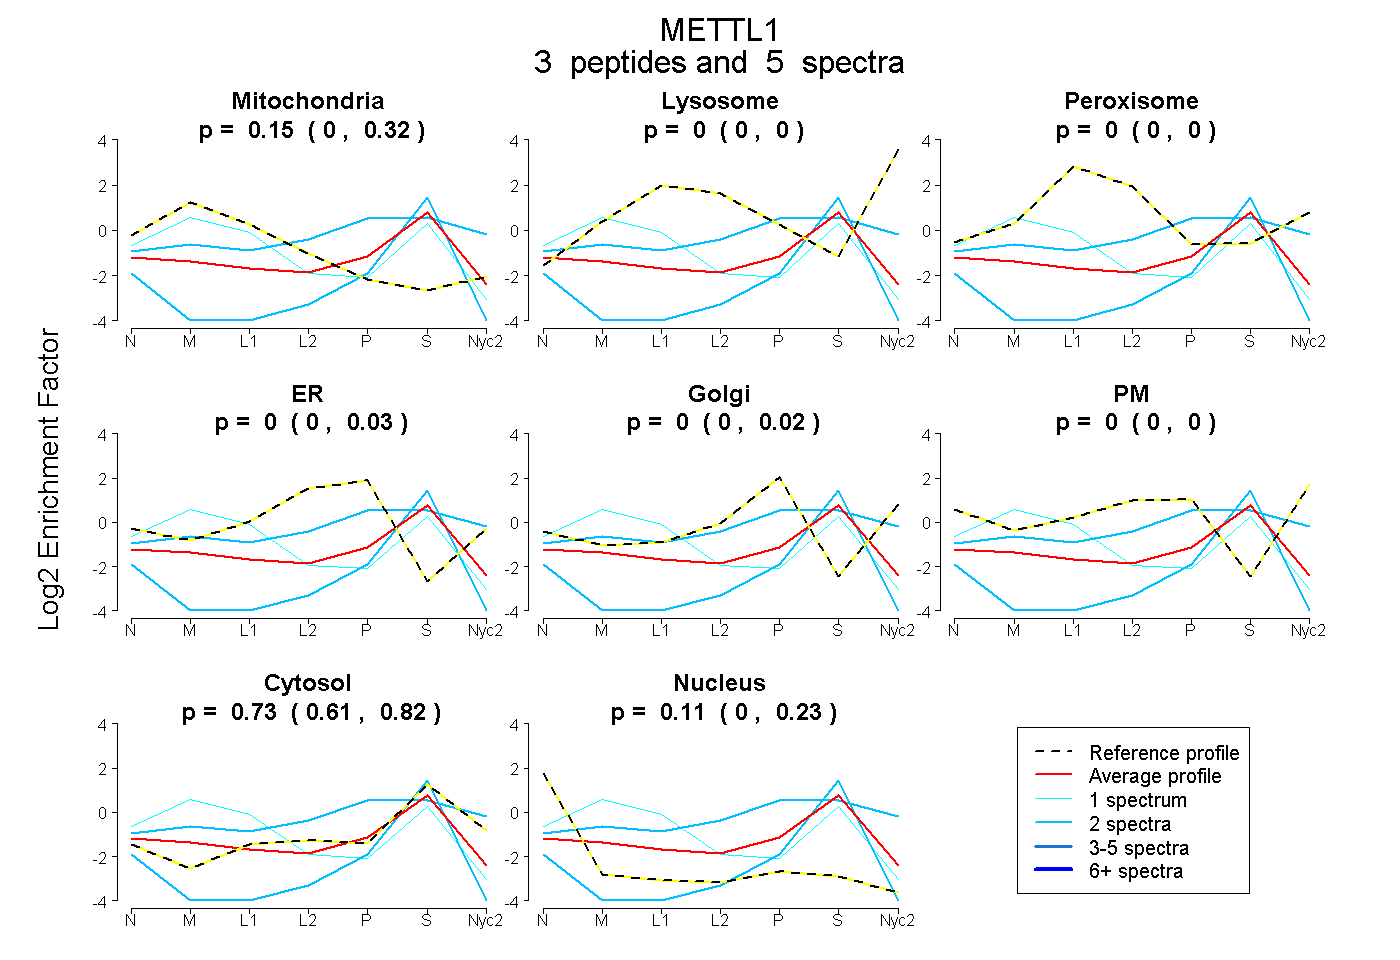
0.000 | 0.325
0.000 | 0.000
0.000 | 0.000
0.000 | 0.034
0.000 | 0.018
0.000 | 0.000
0.612 | 0.822
0.000 | 0.227
2peptides
spectra
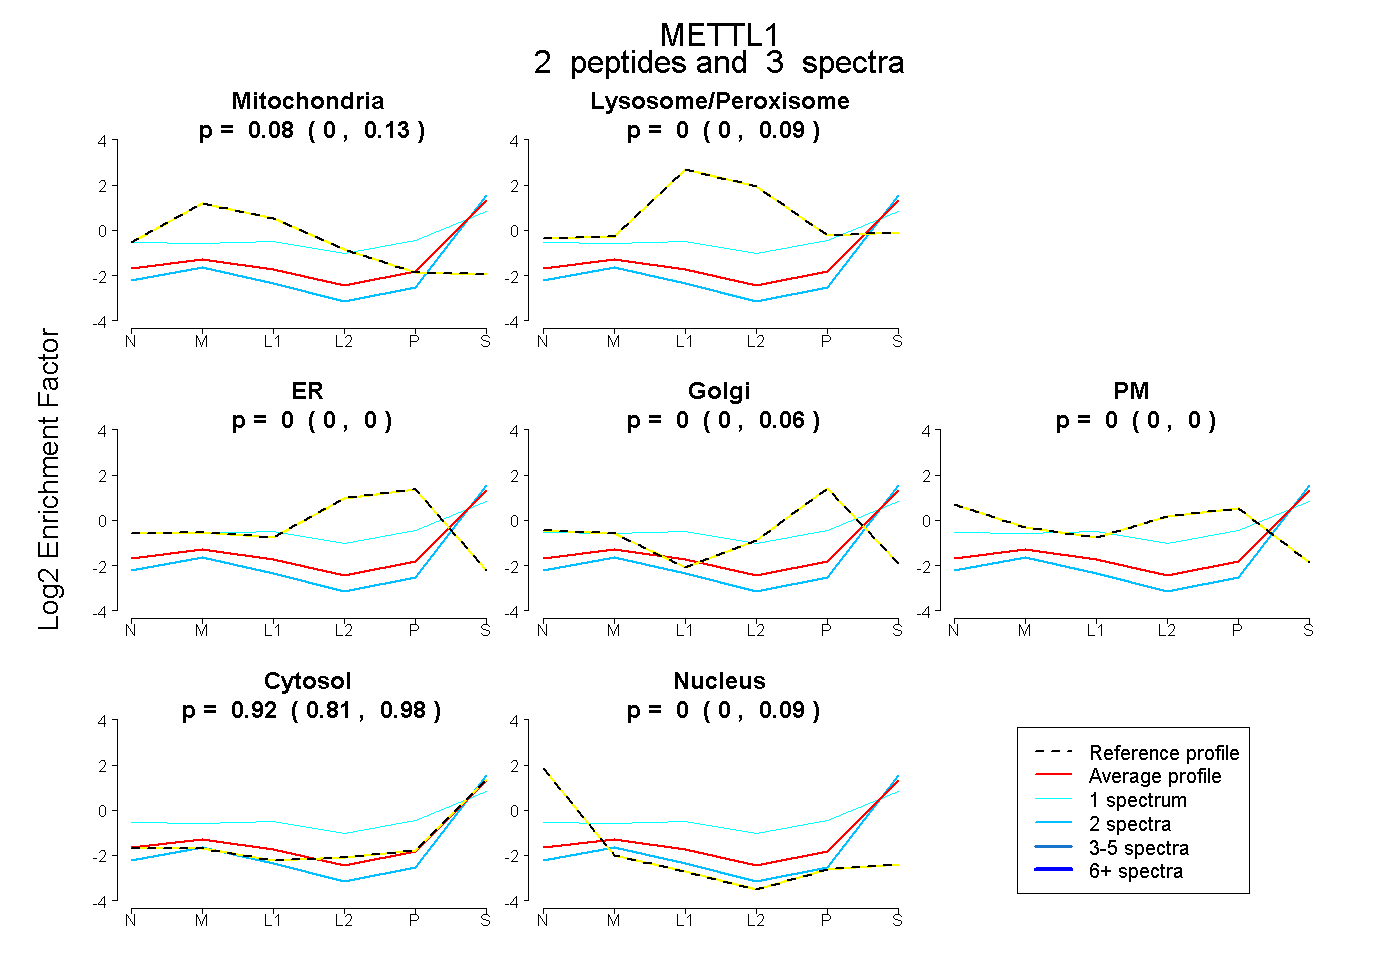
0.000 | 0.131
0.000 | 0.090
0.000 | 0.000
0.000 | 0.062
0.000 | 0.000
0.812 | 0.979
0.000 | 0.085