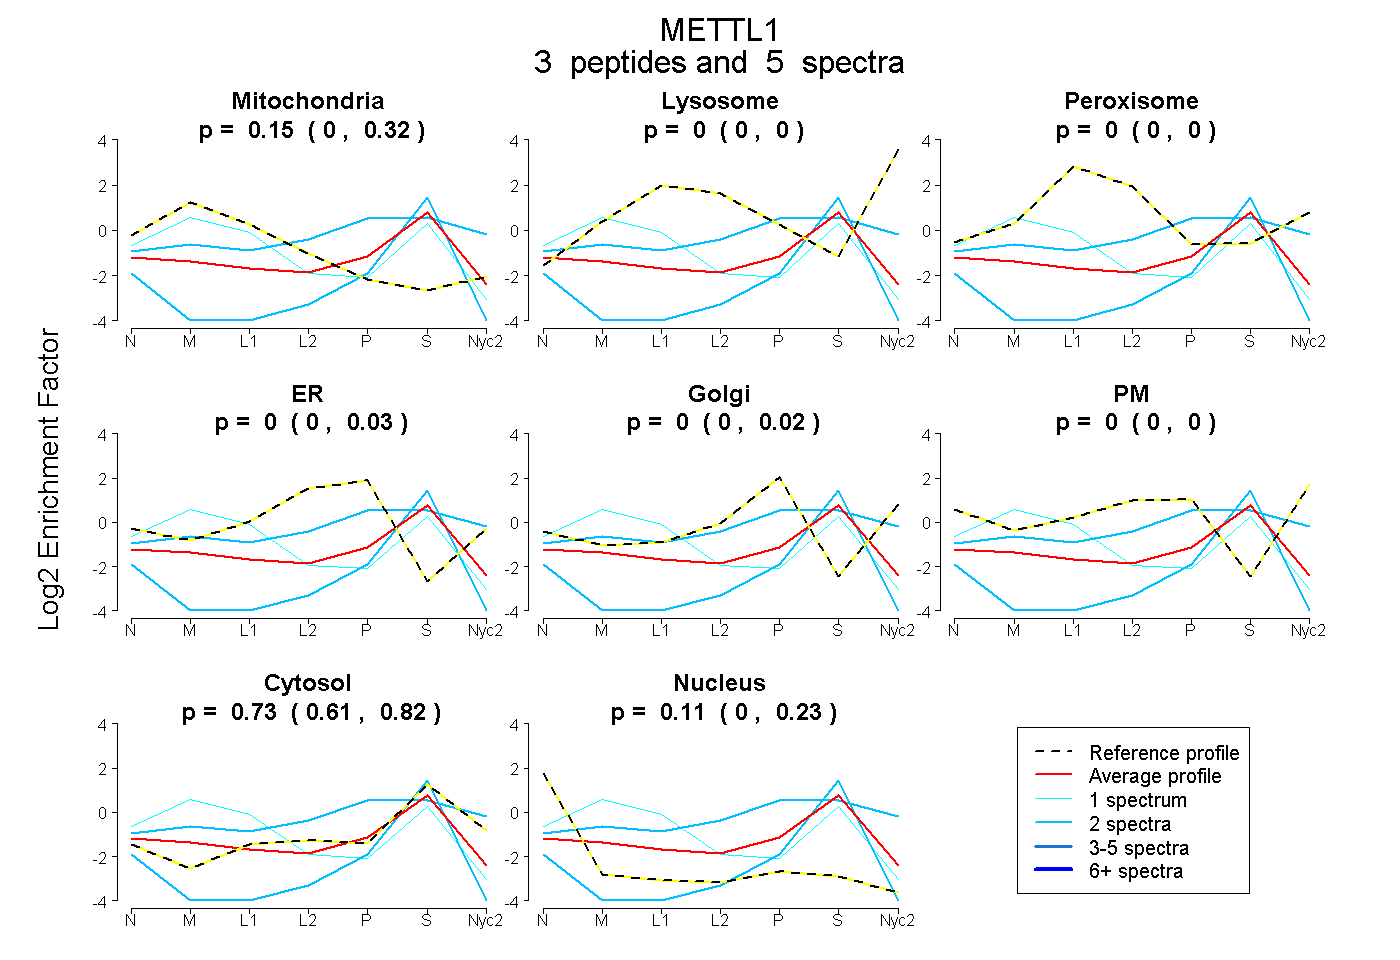
 3
3peptides
spectra
0.000 | 0.325
0.000 | 0.000
0.000 | 0.000
0.000 | 0.034
0.000 | 0.018
0.000 | 0.000
0.612 | 0.822
0.000 | 0.227
| Plot | Mito | Lyso | Perox | ER | Golgi | PM | Cytosol | Nucleus | |||||
| Expt A |
3 peptides |
5 spectra |
|
0.153 0.000 | 0.325 |
0.000 0.000 | 0.000 |
0.000 0.000 | 0.000 |
0.000 0.000 | 0.034 |
0.000 0.000 | 0.018 |
0.000 0.000 | 0.000 |
0.733 0.612 | 0.822 |
0.114 0.000 | 0.227 |
| 1 spectrum, ATPGGGFQNIACLR | 0.605 | 0.000 | 0.000 | 0.000 | 0.000 | 0.000 | 0.395 | 0.000 | ||
| 2 spectra, MFFLFPDPHFK | 0.000 | 0.000 | 0.156 | 0.000 | 0.341 | 0.000 | 0.503 | 0.000 | ||
| 2 spectra, HLPNFFR | 0.000 | 0.000 | 0.000 | 0.000 | 0.000 | 0.000 | 0.639 | 0.361 |
| Plot | Mito | Lyso or Perox | ER | Golgi | PM | Cytosol | Nucleus | ||||||
| Expt B |
2 peptides |
3 spectra |
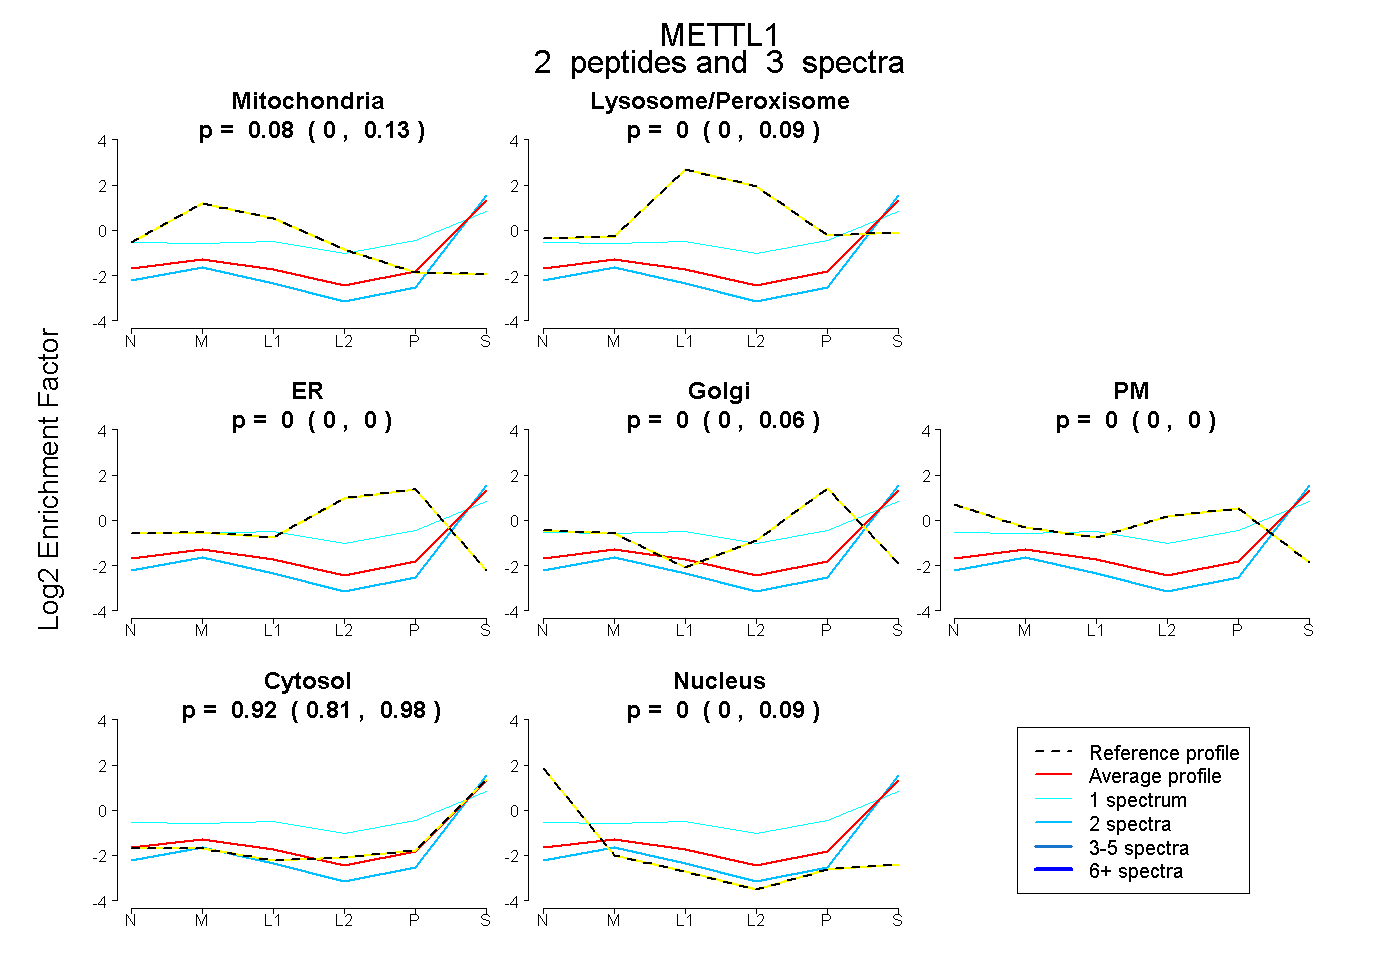 |
0.078 0.000 | 0.131 |
0.000 0.000 | 0.090 |
0.000 0.000 | 0.000 |
0.000 0.000 | 0.062 |
0.000 0.000 | 0.000 |
0.922 0.812 | 0.979 |
0.000 0.000 | 0.085 |