10
10peptides
spectra
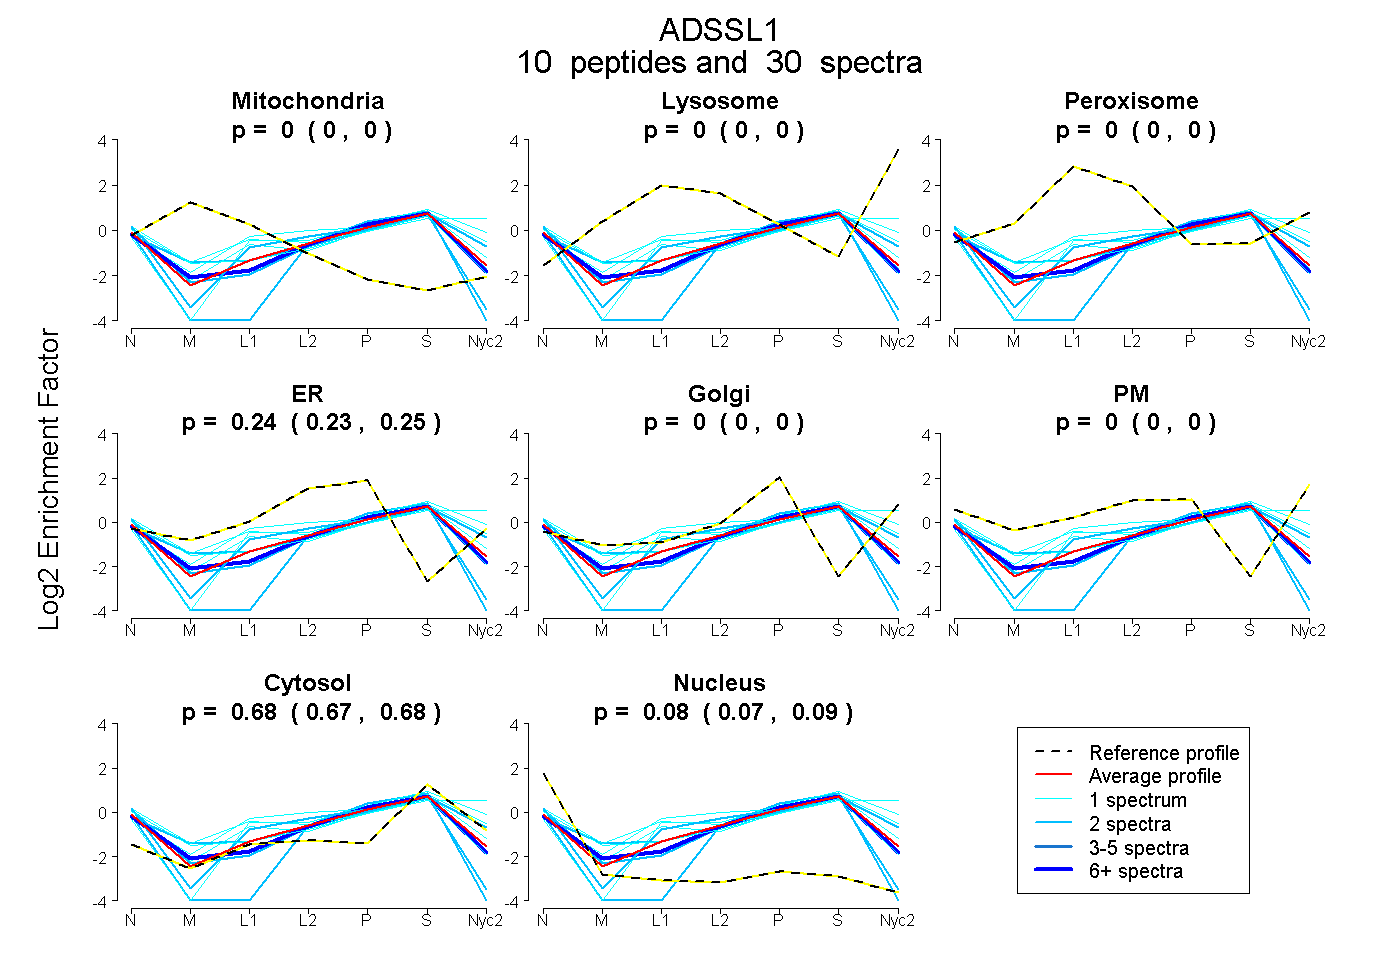
0.000 | 0.000
0.000 | 0.000
0.000 | 0.000
0.233 | 0.248
0.000 | 0.000
0.000 | 0.000
0.667 | 0.683
0.070 | 0.093
3peptides
spectra
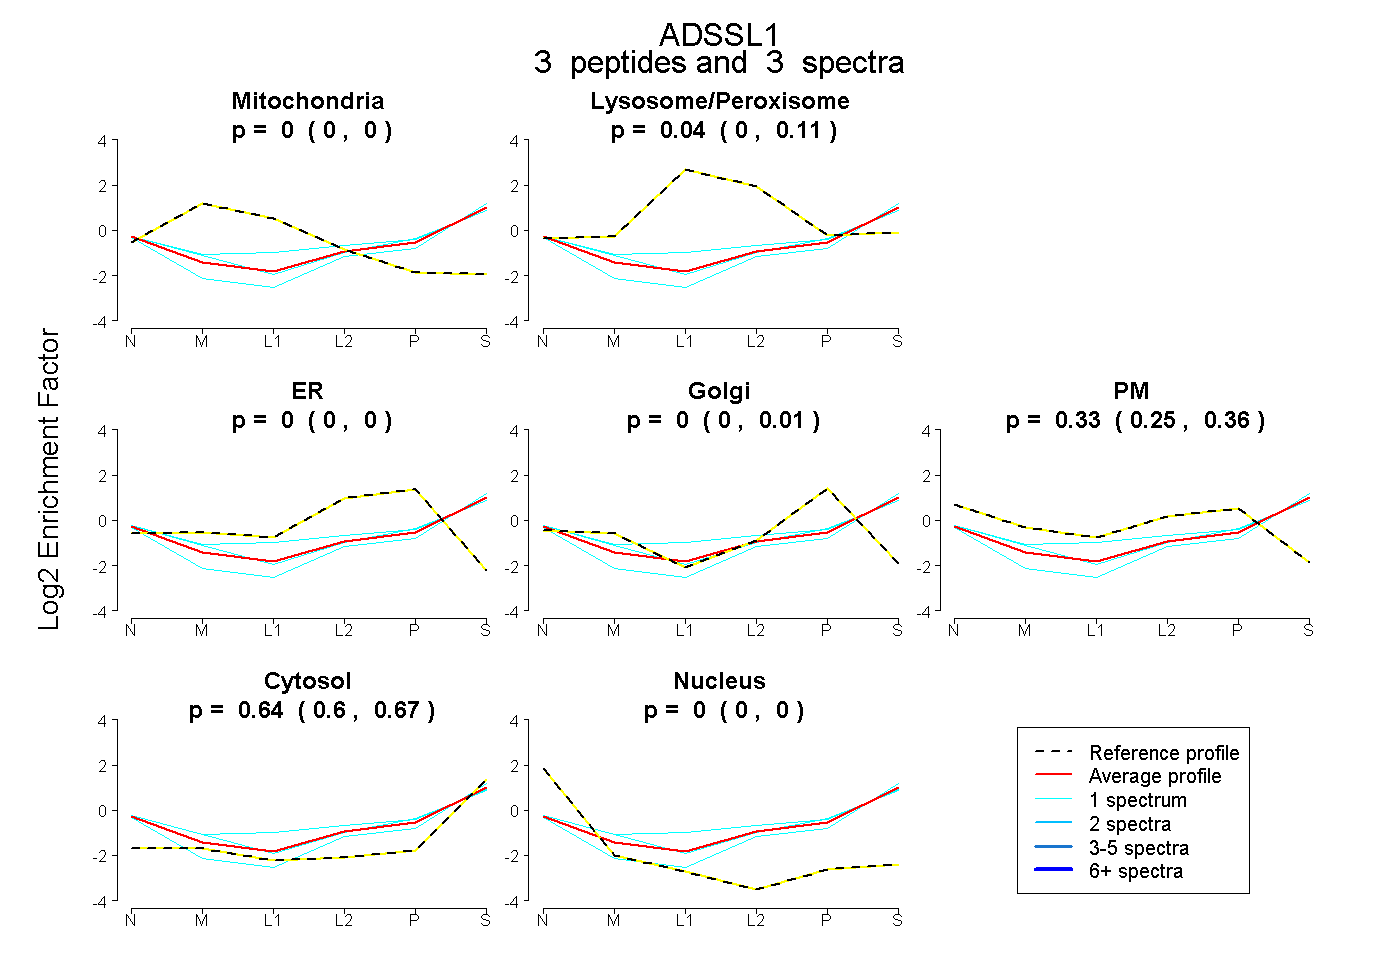
0.000 | 0.000
0.000 | 0.107
0.000 | 0.000
0.000 | 0.008
0.252 | 0.361
0.600 | 0.670
0.000 | 0.000