 10
10peptides
spectra
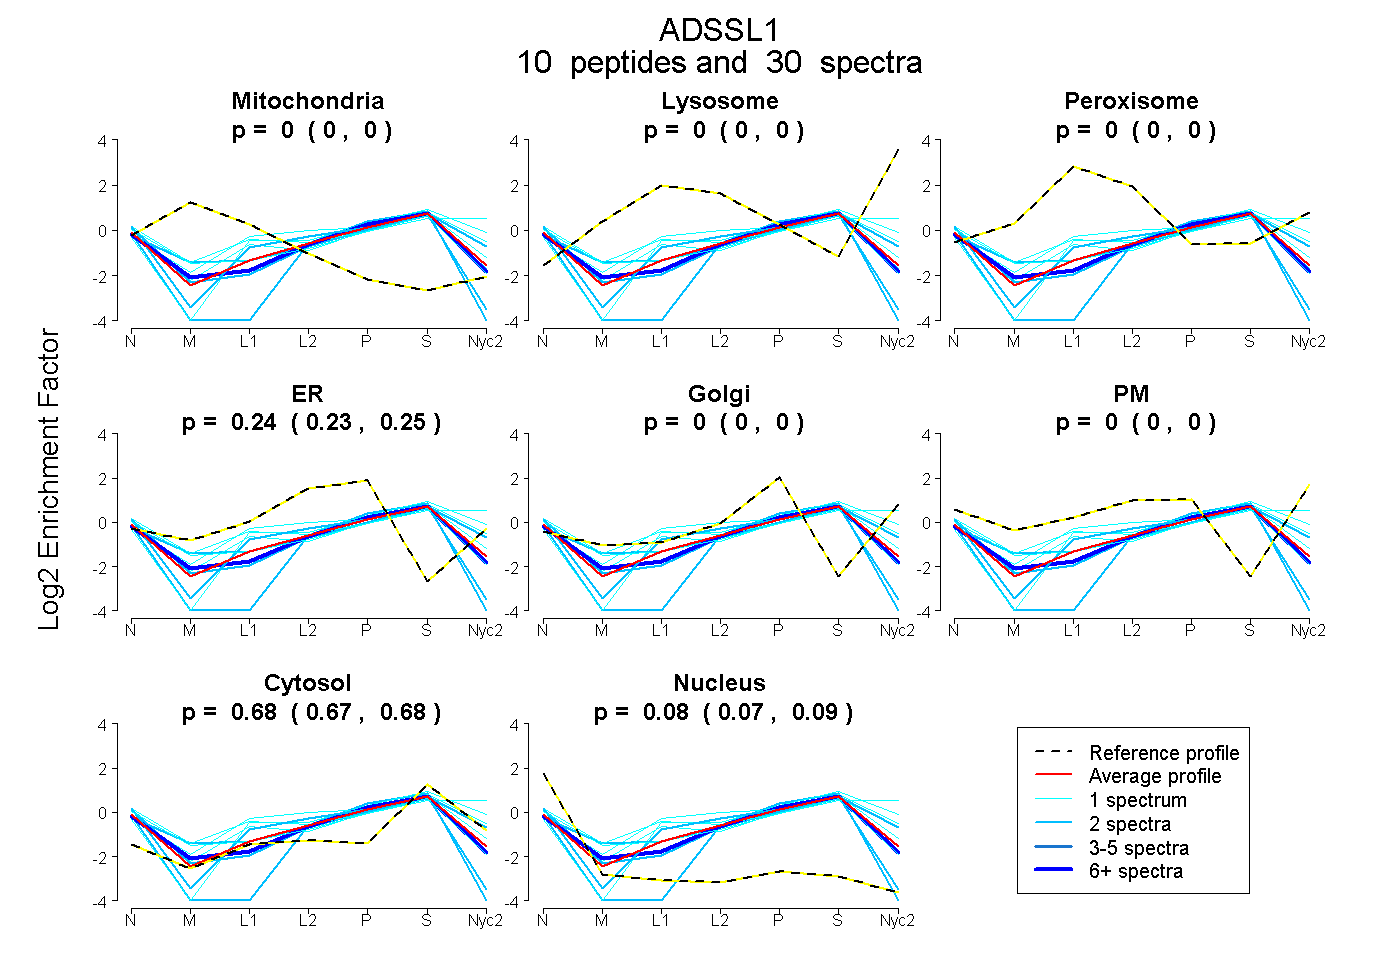
0.000 | 0.000
0.000 | 0.000
0.000 | 0.000
0.233 | 0.248
0.000 | 0.000
0.000 | 0.000
0.667 | 0.683
0.070 | 0.093
| Plot | Mito | Lyso | Perox | ER | Golgi | PM | Cytosol | Nucleus | |||||
| Expt A |
10 peptides |
30 spectra |
|
0.000 0.000 | 0.000 |
0.000 0.000 | 0.000 |
0.000 0.000 | 0.000 |
0.242 0.233 | 0.248 |
0.000 0.000 | 0.000 |
0.000 0.000 | 0.000 |
0.676 0.667 | 0.683 |
0.083 0.070 | 0.093 |
| 1 spectrum, DGVYFMYEALHGPPK | 0.000 | 0.000 | 0.111 | 0.269 | 0.000 | 0.000 | 0.619 | 0.000 | ||
| 2 spectra, VEVEYETLPGWK | 0.000 | 0.000 | 0.000 | 0.276 | 0.000 | 0.000 | 0.714 | 0.011 | ||
| 1 spectrum, LDILDVLSEIK | 0.000 | 0.000 | 0.057 | 0.000 | 0.000 | 0.384 | 0.559 | 0.000 | ||
| 17 spectra, IRPMVR | 0.000 | 0.000 | 0.000 | 0.237 | 0.000 | 0.000 | 0.653 | 0.109 | ||
| 2 spectra, ICDLLSDFDEFSAR | 0.000 | 0.000 | 0.000 | 0.166 | 0.000 | 0.000 | 0.565 | 0.270 | ||
| 1 spectrum, GIGPTYSSK | 0.000 | 0.000 | 0.000 | 0.076 | 0.012 | 0.187 | 0.725 | 0.000 | ||
| 1 spectrum, EYDFHLLPSGIINTK | 0.000 | 0.000 | 0.000 | 0.122 | 0.088 | 0.045 | 0.744 | 0.000 | ||
| 2 spectra, AHLVFDFHQAVDGLQEVQR | 0.000 | 0.000 | 0.000 | 0.014 | 0.000 | 0.000 | 0.622 | 0.363 | ||
| 1 spectrum, VGISYK | 0.006 | 0.000 | 0.000 | 0.254 | 0.000 | 0.000 | 0.613 | 0.127 | ||
| 2 spectra, FVENHLGVAVK | 0.025 | 0.000 | 0.000 | 0.259 | 0.000 | 0.000 | 0.634 | 0.083 |
| Plot | Mito | Lyso or Perox | ER | Golgi | PM | Cytosol | Nucleus | ||||||
| Expt B |
3 peptides |
3 spectra |
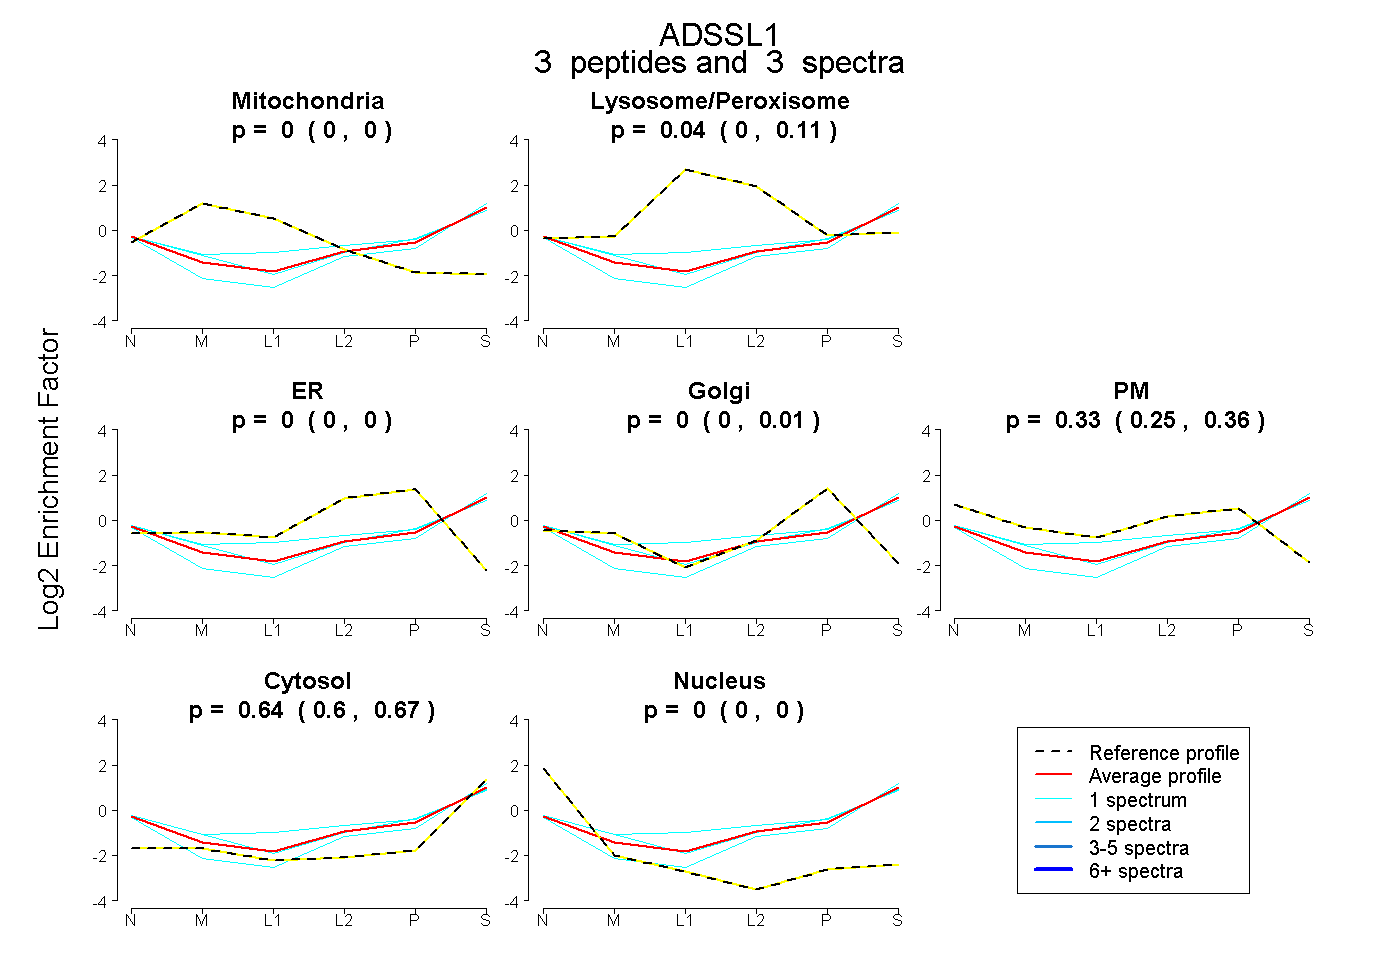 |
0.000 0.000 | 0.000 |
0.035 0.000 | 0.107 |
0.000 0.000 | 0.000 |
0.000 0.000 | 0.008 |
0.325 0.252 | 0.361 |
0.639 0.600 | 0.670 |
0.000 0.000 | 0.000 |
|||
| Plot | Lyso | Other | |||||||||||
| Expt C |
11 peptides |
19 spectra |
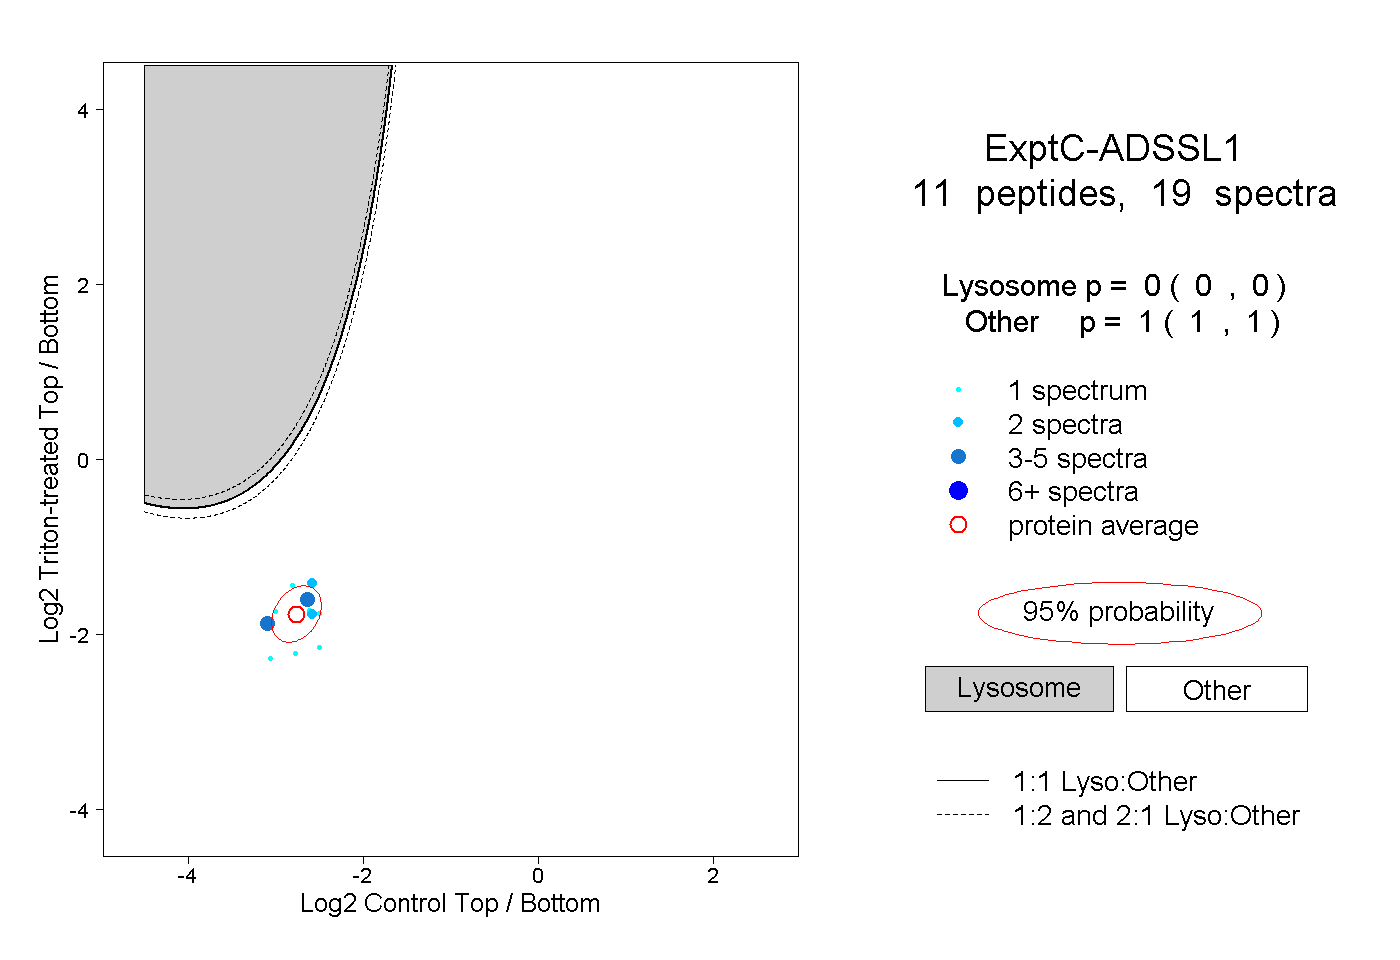 |
0.000 0.000 | 0.000 |
1.000 1.000 | 1.000 |