 22
22peptides
spectra
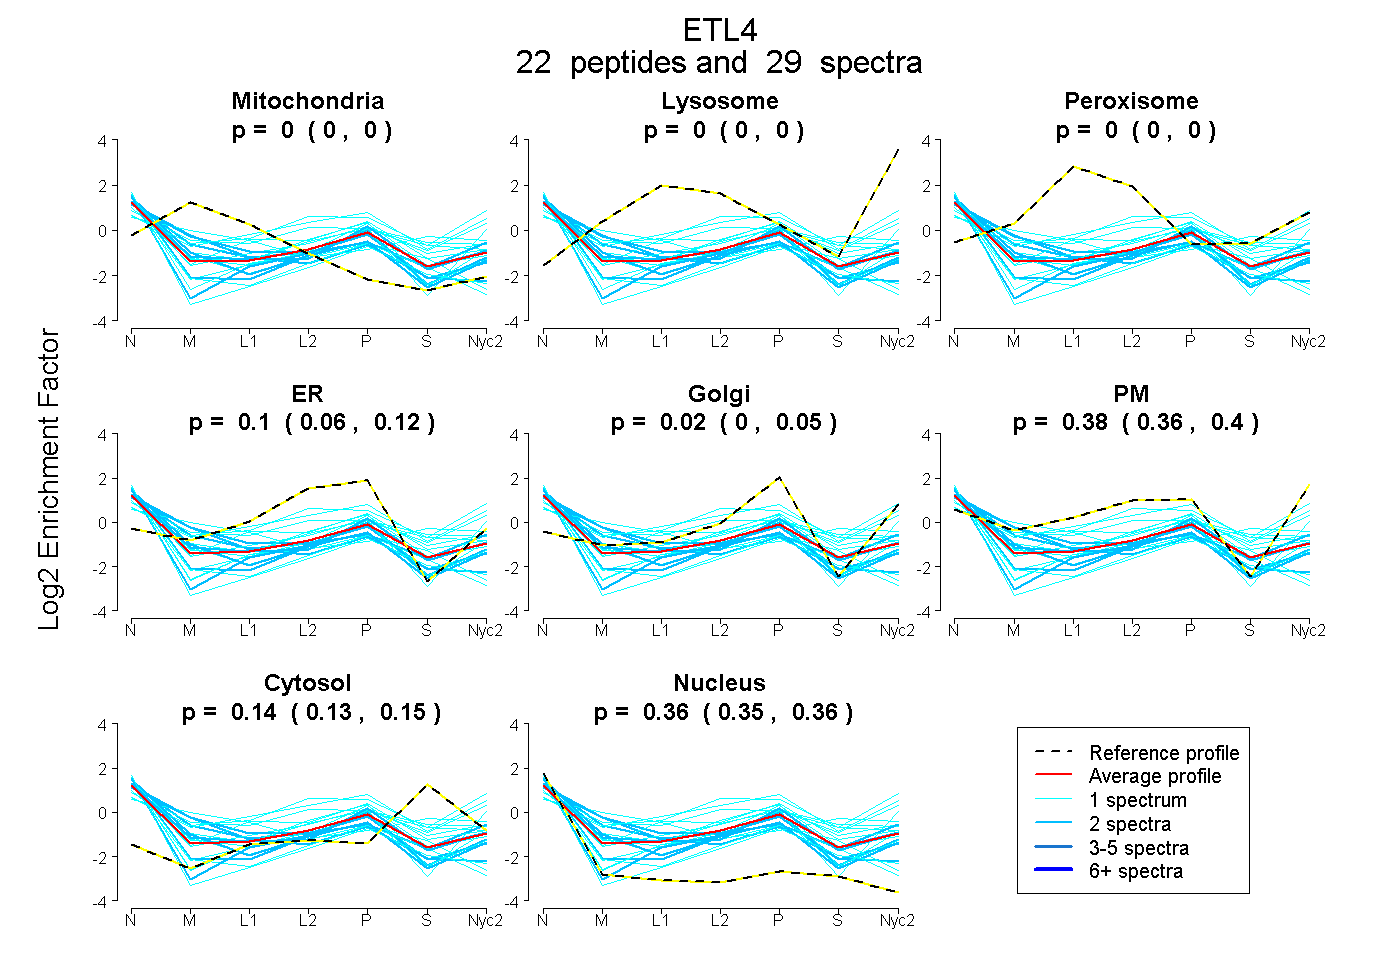
0.000 | 0.000
0.000 | 0.000
0.000 | 0.000
0.063 | 0.123
0.000 | 0.048
0.359 | 0.402
0.129 | 0.148
0.348 | 0.363
2peptides
spectra
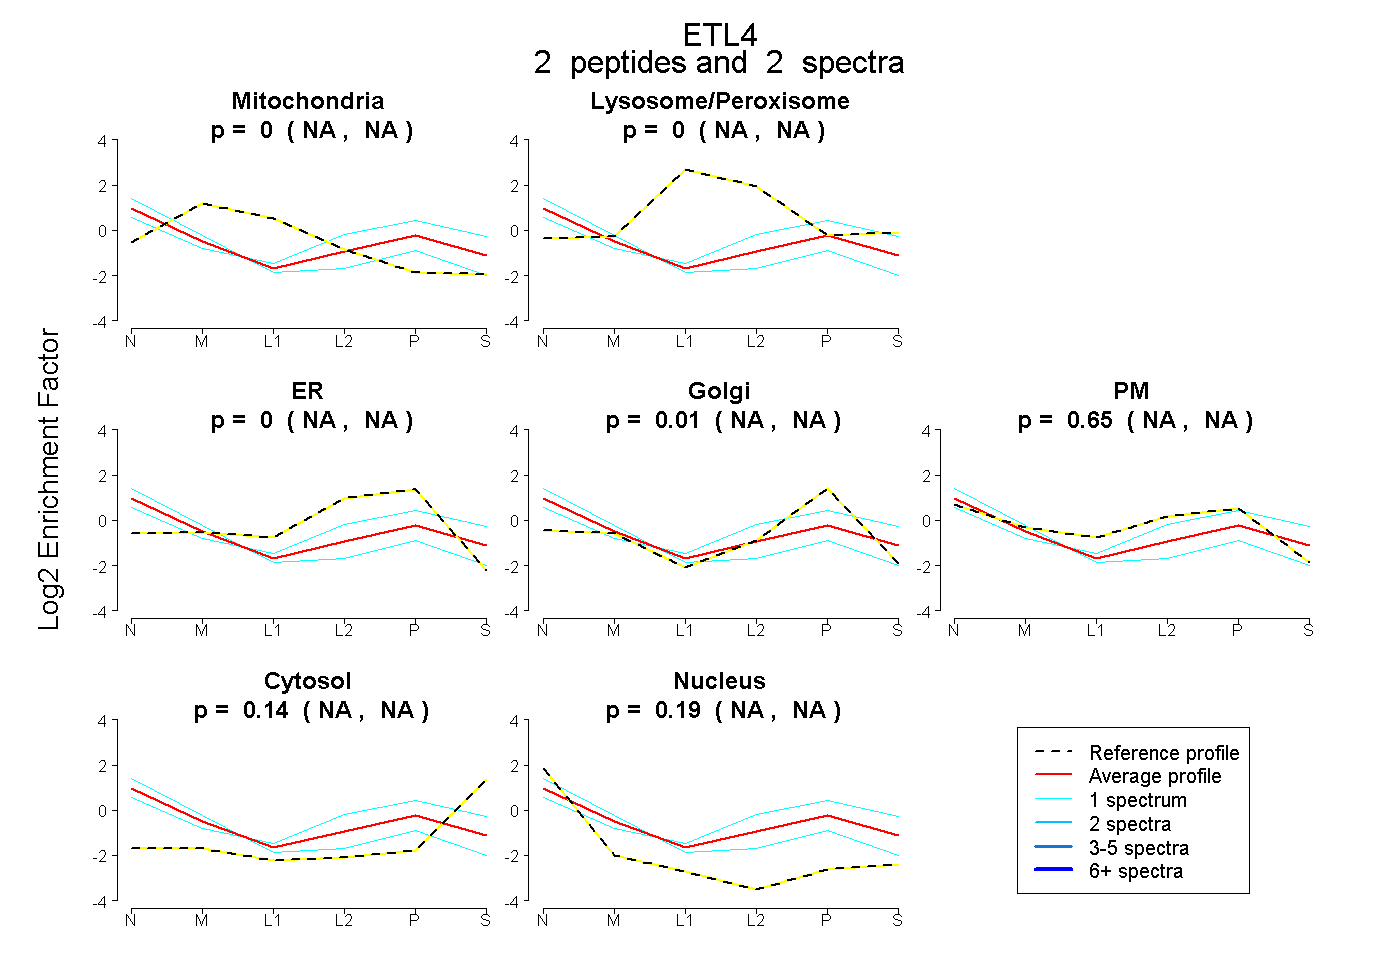
NA | NA
NA | NA
NA | NA
NA | NA
NA | NA
NA | NA
NA | NA
6peptides
spectra
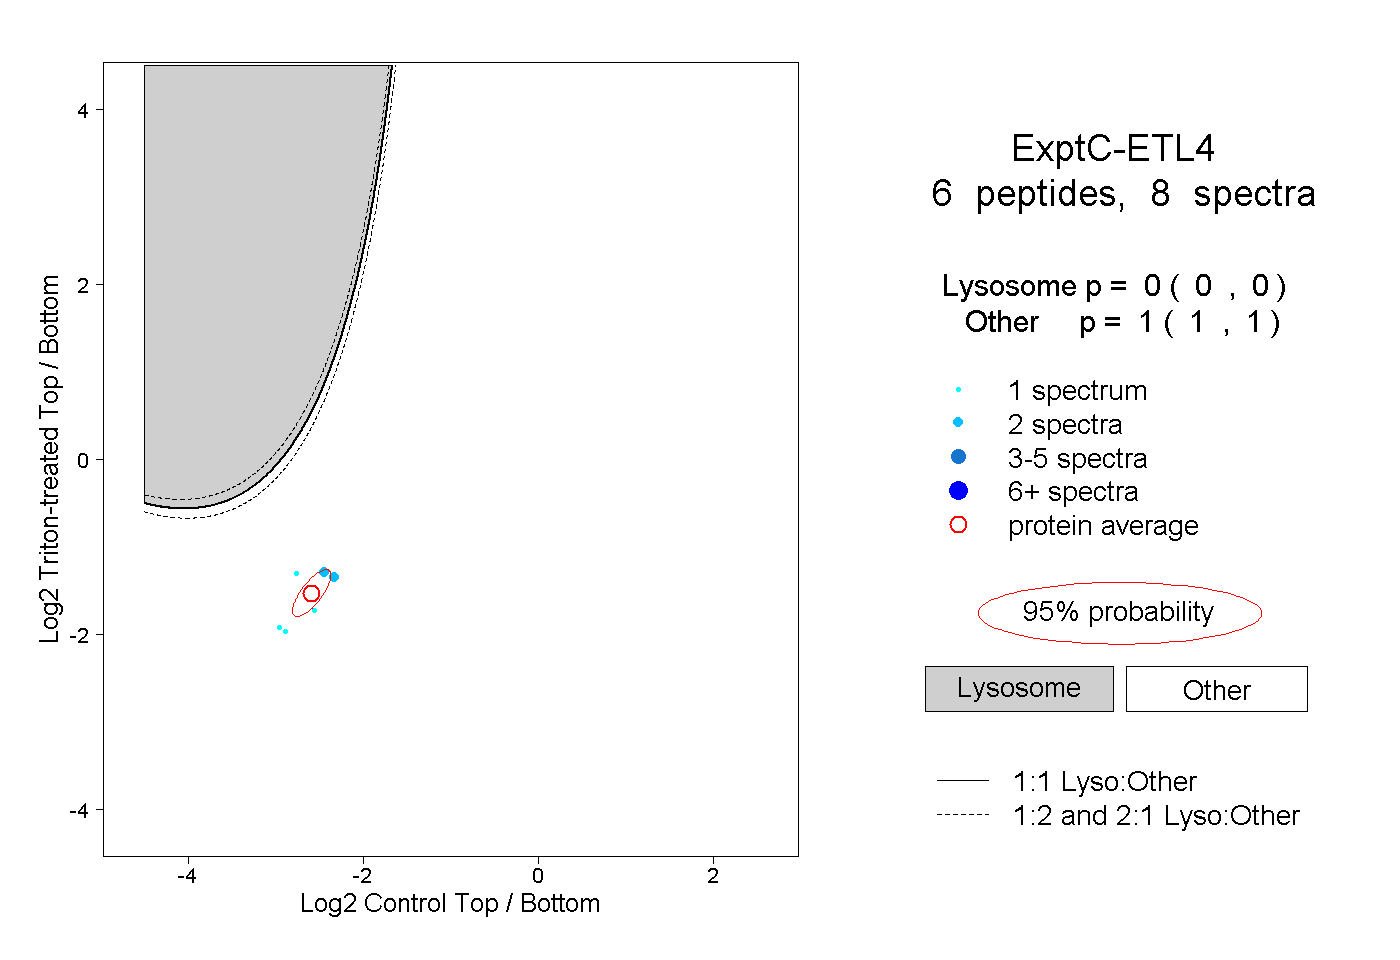
0.000 | 0.000
1.000 | 1.000