 3
3peptides
spectra
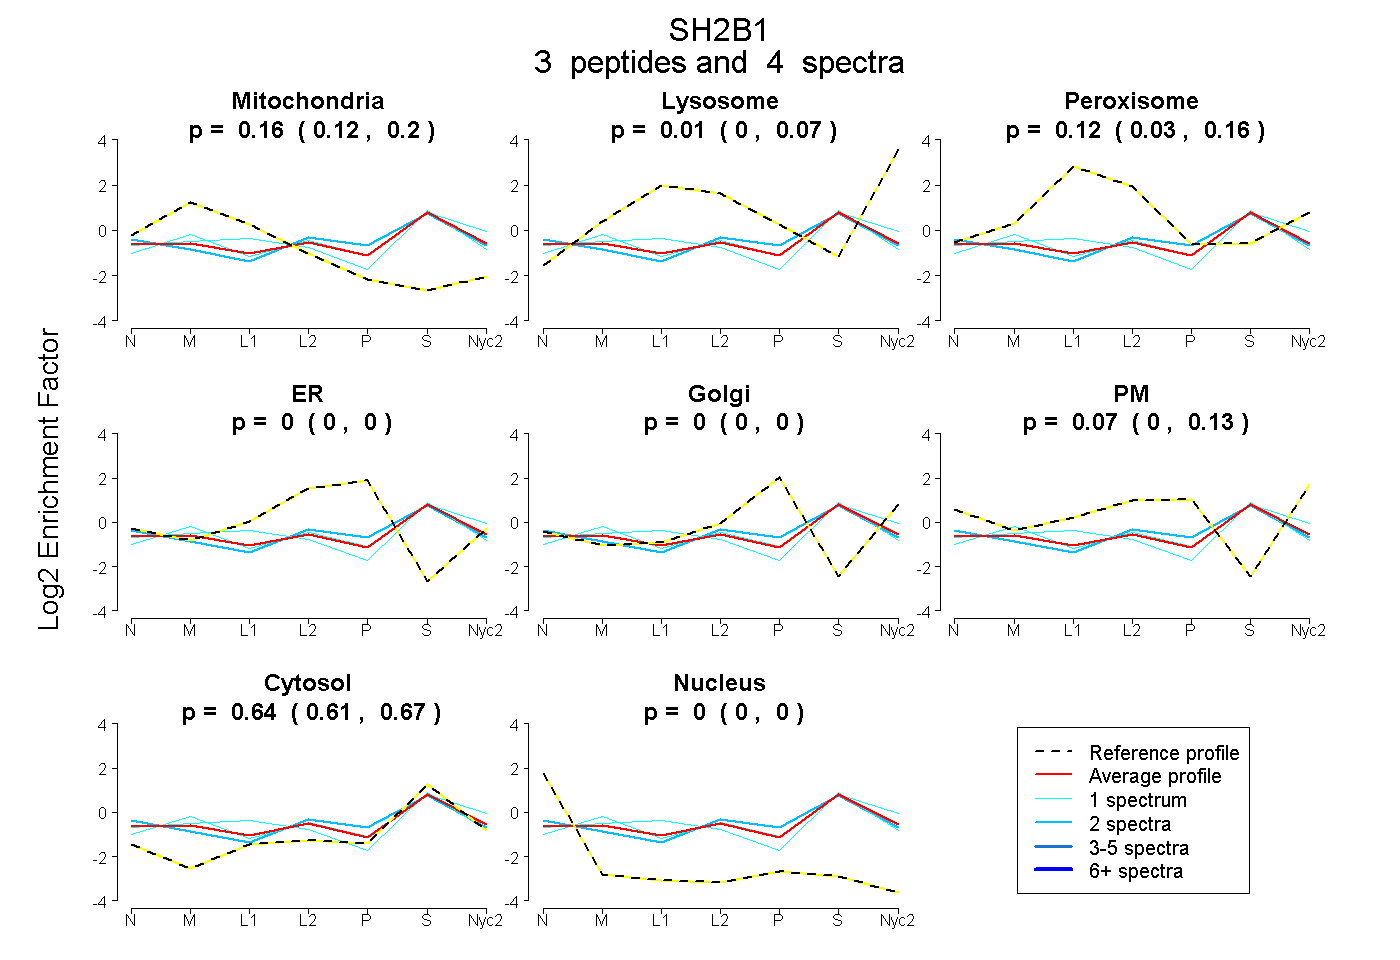
0.117 | 0.202
0.000 | 0.071
0.033 | 0.164
0.000 | 0.000
0.000 | 0.000
0.000 | 0.129
0.611 | 0.670
0.000 | 0.000
1peptide
spectra
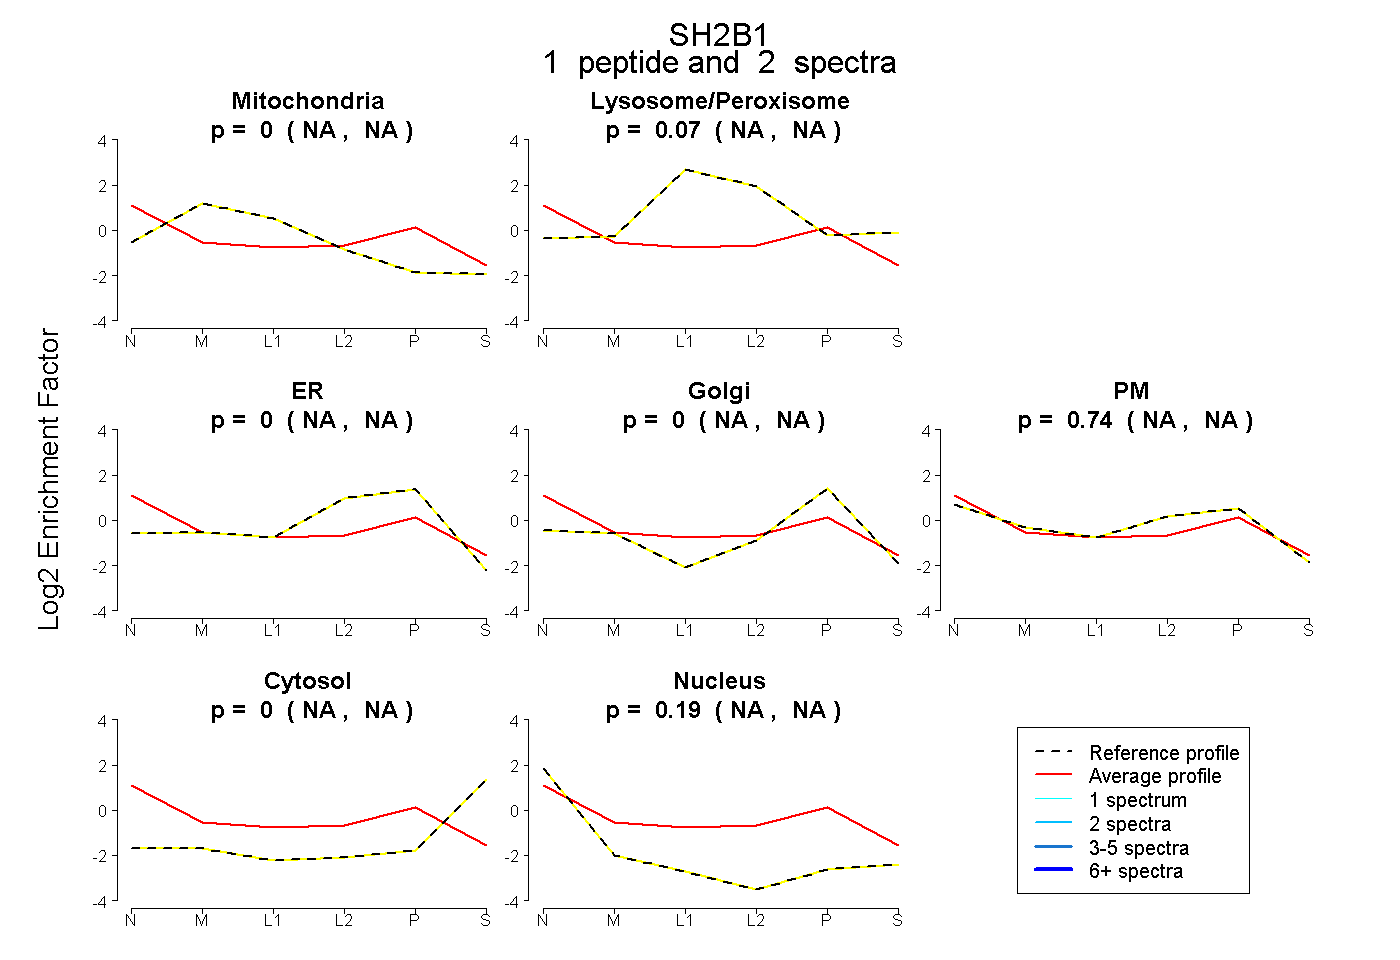
NA | NA
NA | NA
NA | NA
NA | NA
NA | NA
NA | NA
NA | NA
1peptide
spectrum
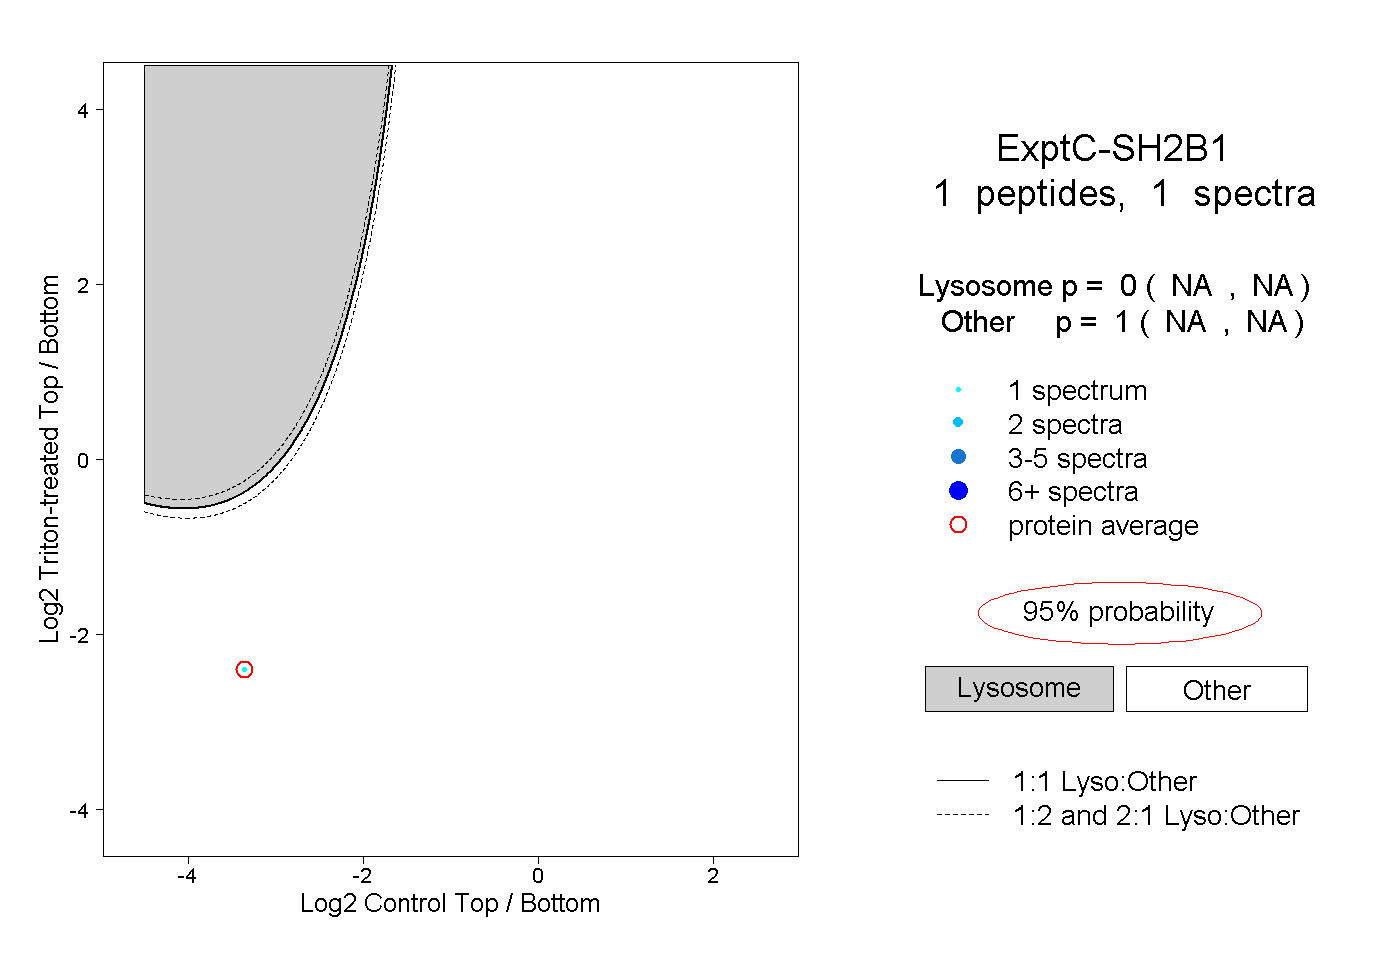
NA | NA
NA | NA