 4
4peptides
spectra
0.000 | 0.000
0.000 | 0.107
0.000 | 0.143
0.113 | 0.414
0.000 | 0.034
0.424 | 0.742
0.000 | 0.000
0.000 | 0.001
6peptides
spectra
0.000 | 0.000
1.000 | 1.000
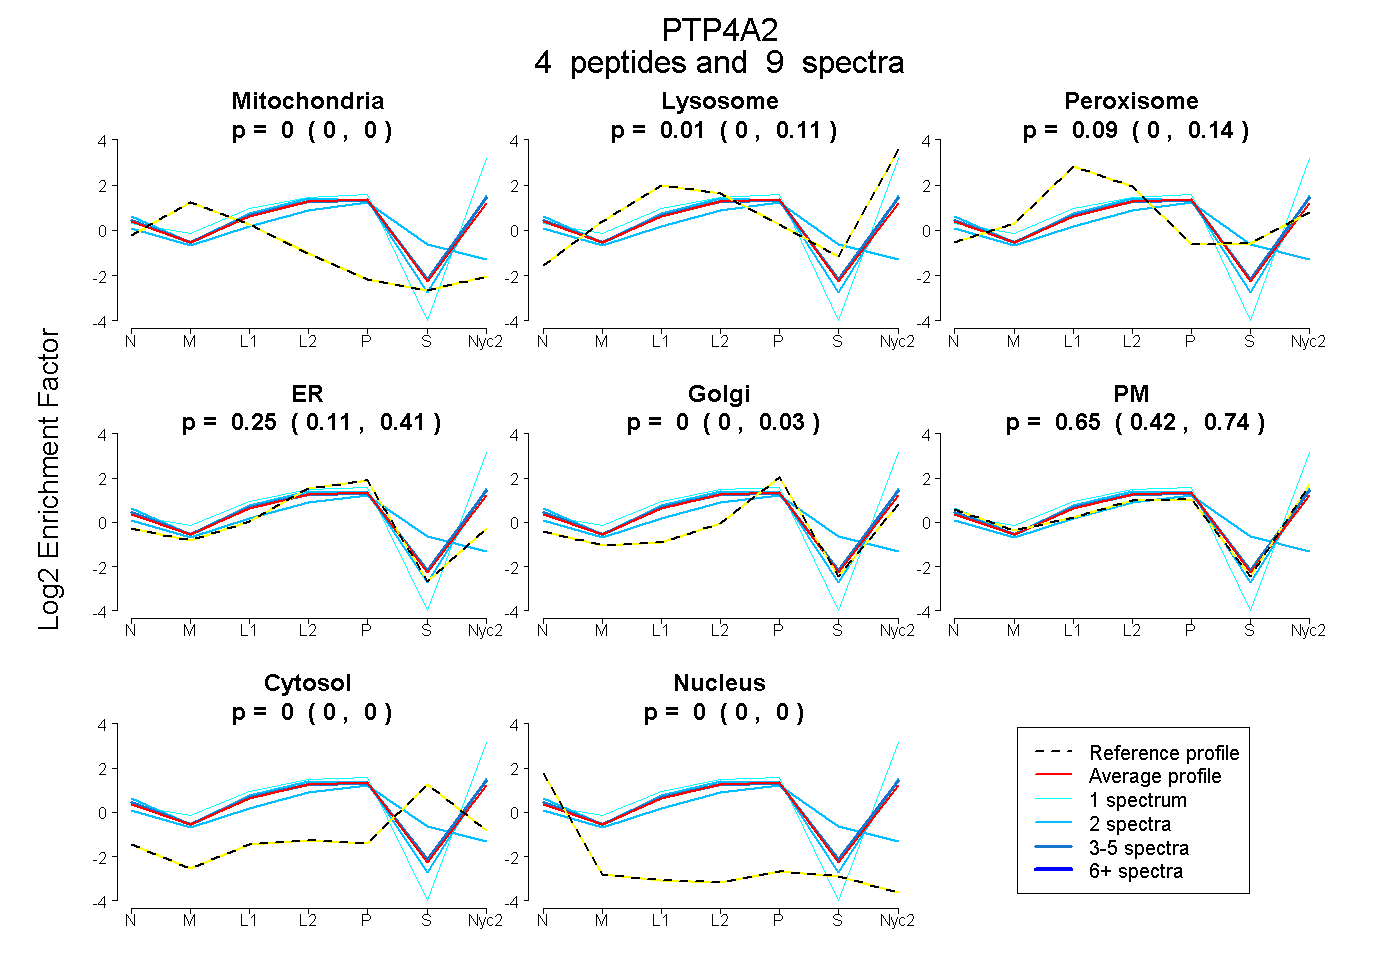
| Plot | Mito | Lyso | Perox | ER | Golgi | PM | Cytosol | Nucleus | |||||
| Expt A |
4 peptides |
9 spectra |
|
0.000 0.000 | 0.000 |
0.009 0.000 | 0.107 |
0.090 0.000 | 0.143 |
0.253 0.113 | 0.414 |
0.000 0.000 | 0.034 |
0.647 0.424 | 0.742 |
0.000 0.000 | 0.000 |
0.000 0.000 | 0.001 |
||
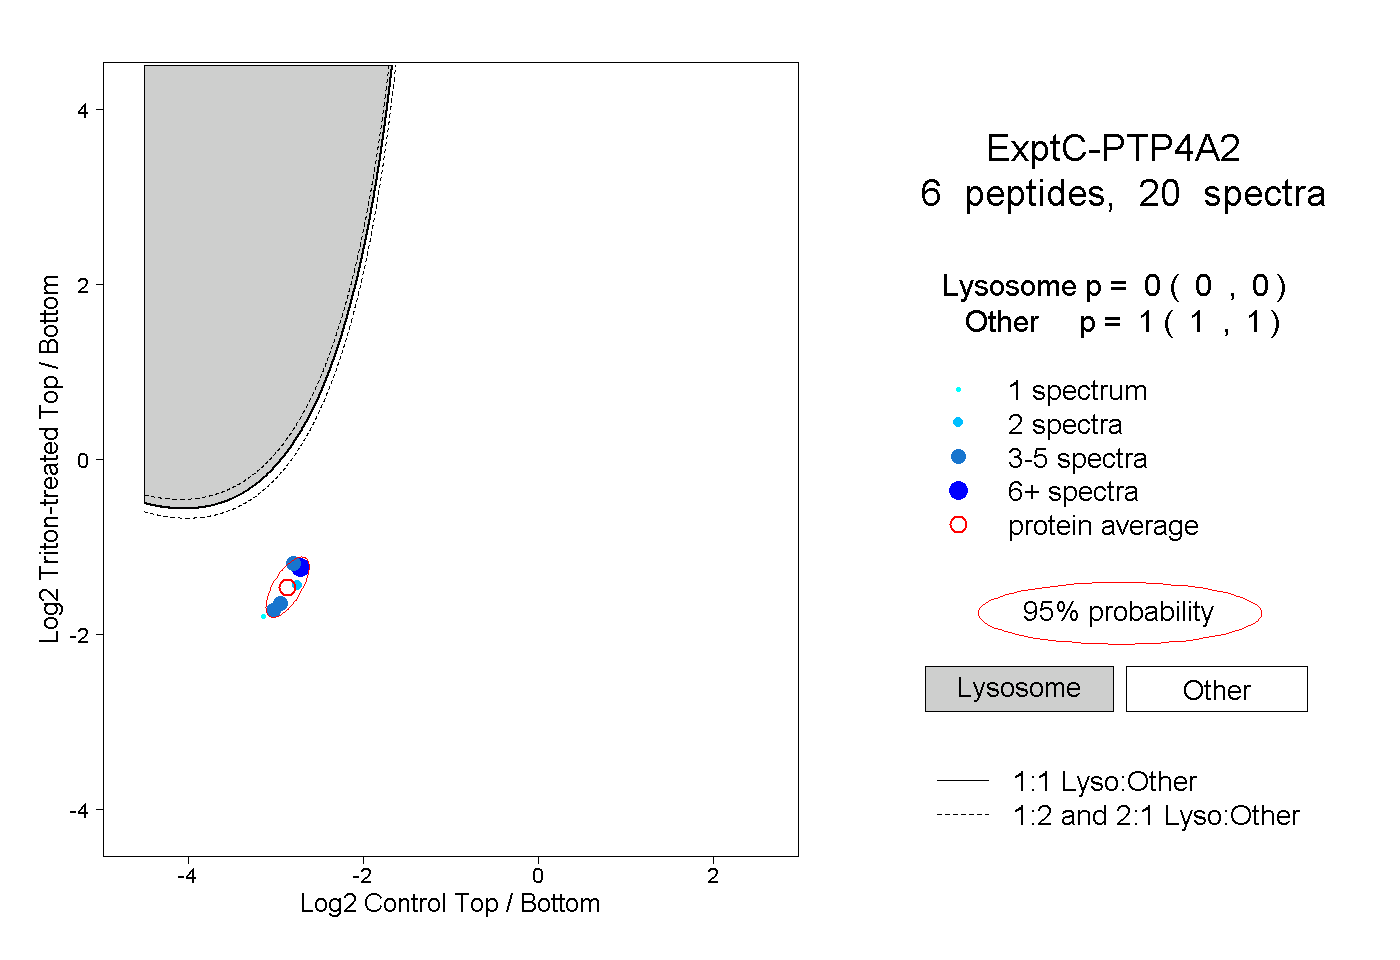
| Plot | Lyso | Other | |||||||||||
| Expt C |
6 peptides |
20 spectra |
|
0.000 0.000 | 0.000 |
1.000 1.000 | 1.000 |