 4
4peptides
spectra
0.000 | 0.000
0.000 | 0.000
0.000 | 0.000
0.000 | 0.000
0.000 | 0.000
0.000 | 0.000
0.590 | 0.677
0.317 | 0.401
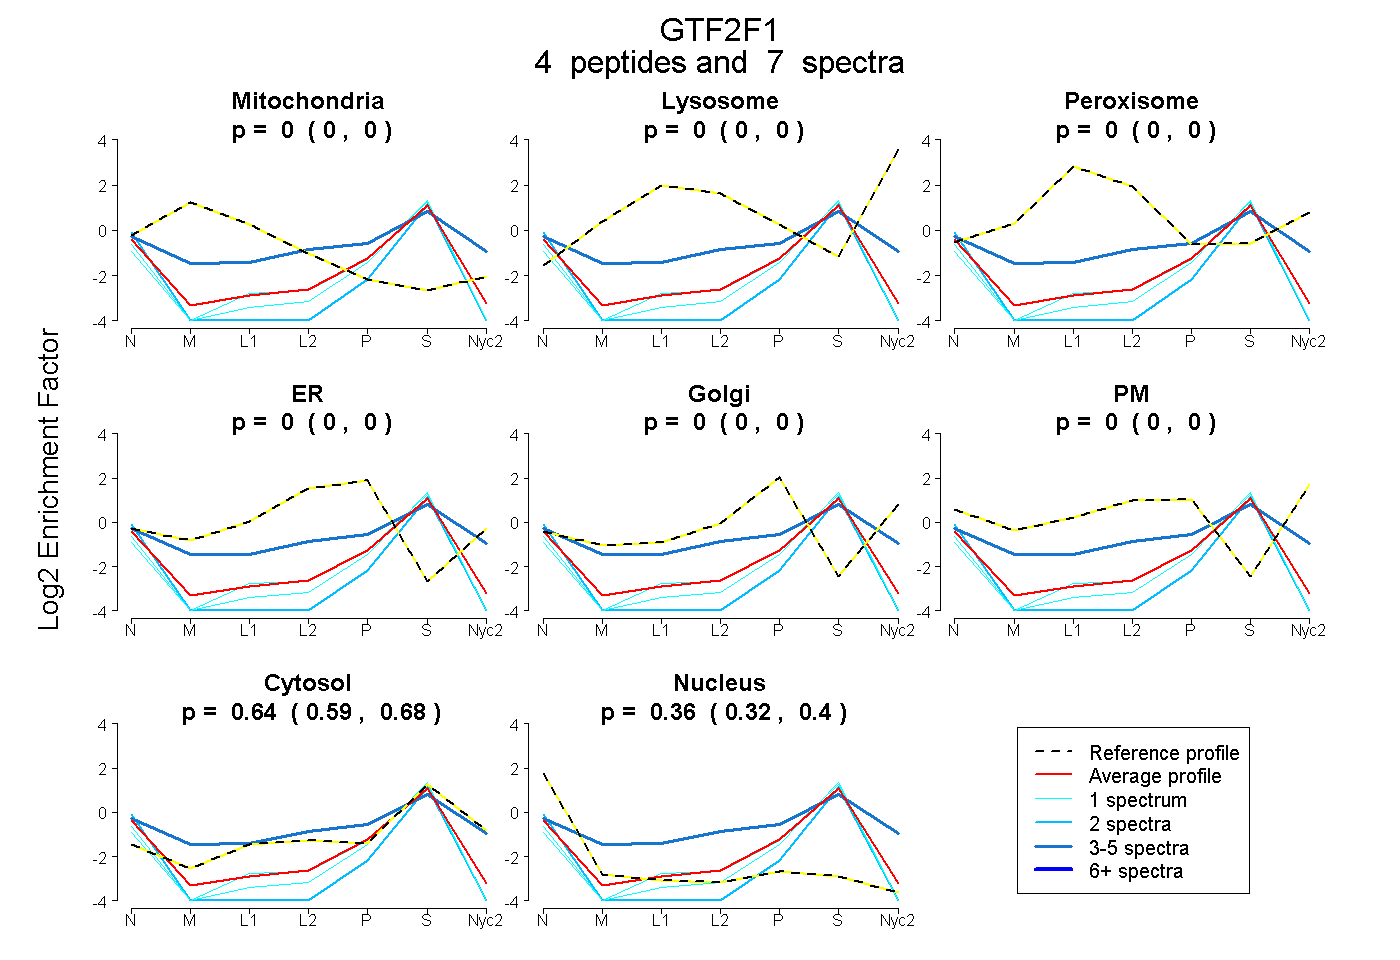
| Plot | Mito | Lyso | Perox | ER | Golgi | PM | Cytosol | Nucleus | |||||
| Expt A |
4 peptides |
7 spectra |
|
0.000 0.000 | 0.000 |
0.000 0.000 | 0.000 |
0.000 0.000 | 0.000 |
0.000 0.000 | 0.000 |
0.000 0.000 | 0.000 |
0.000 0.000 | 0.000 |
0.637 0.590 | 0.677 |
0.363 0.317 | 0.401 |
| 1 spectrum, VNFATWNQAR | 0.000 | 0.000 | 0.000 | 0.000 | 0.000 | 0.000 | 0.619 | 0.381 | ||
| 3 spectra, VPQQEDGPK | 0.036 | 0.000 | 0.000 | 0.078 | 0.000 | 0.116 | 0.722 | 0.049 | ||
| 1 spectrum, STPSSGDVQVTEDAVR | 0.000 | 0.000 | 0.000 | 0.000 | 0.000 | 0.000 | 0.597 | 0.403 | ||
| 2 spectra, EFRPEDQPWLLR | 0.000 | 0.000 | 0.000 | 0.000 | 0.000 | 0.000 | 0.437 | 0.563 |