 46
46peptides
spectra
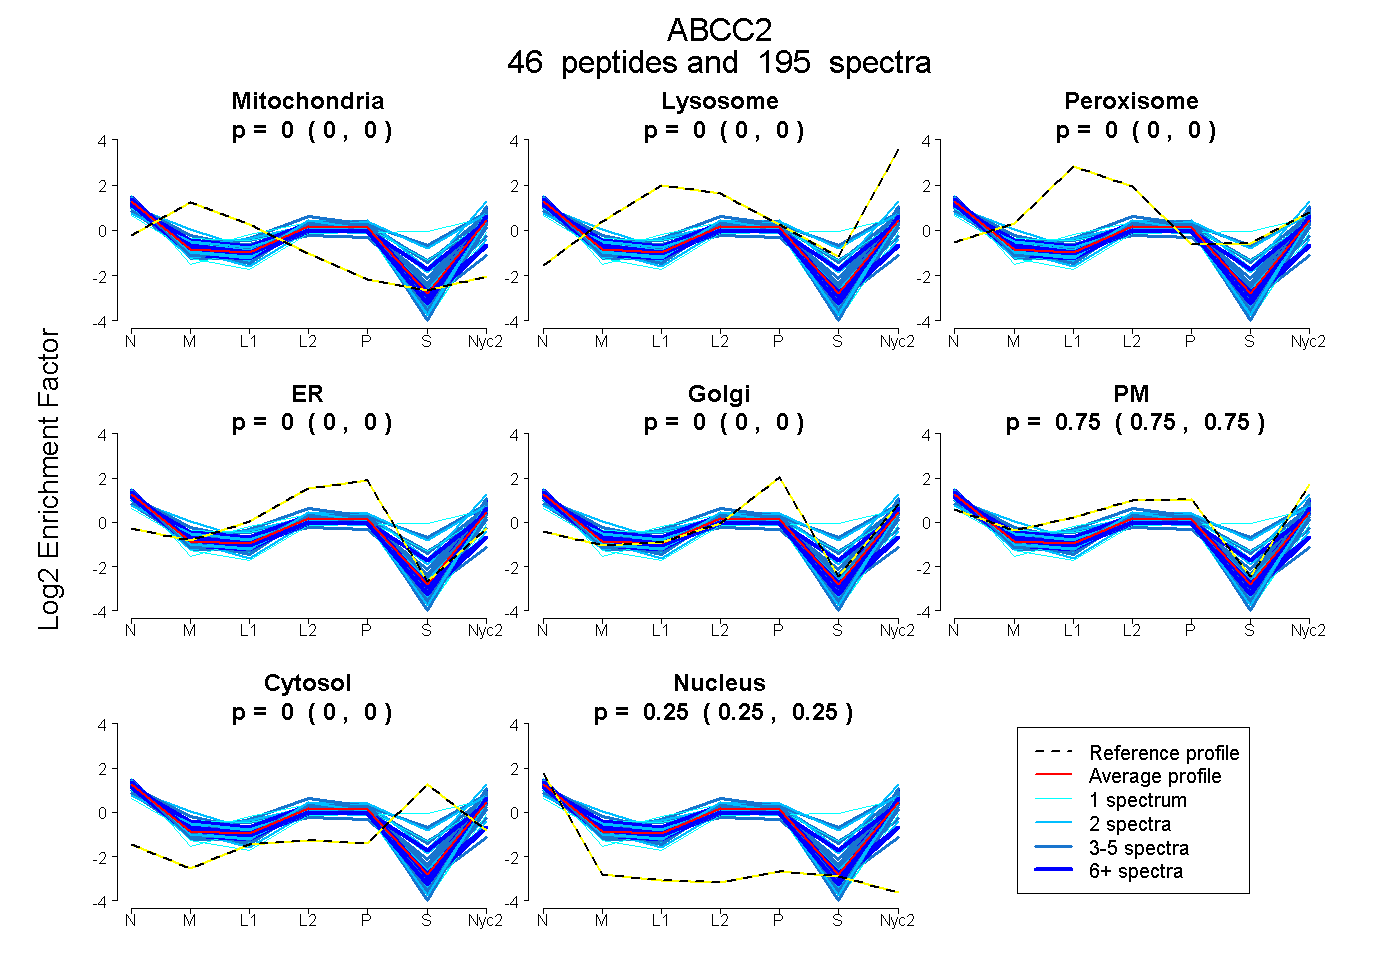
0.000 | 0.000
0.000 | 0.000
0.000 | 0.000
0.000 | 0.000
0.000 | 0.000
0.748 | 0.749
0.000 | 0.000
0.250 | 0.252
18peptides
spectra
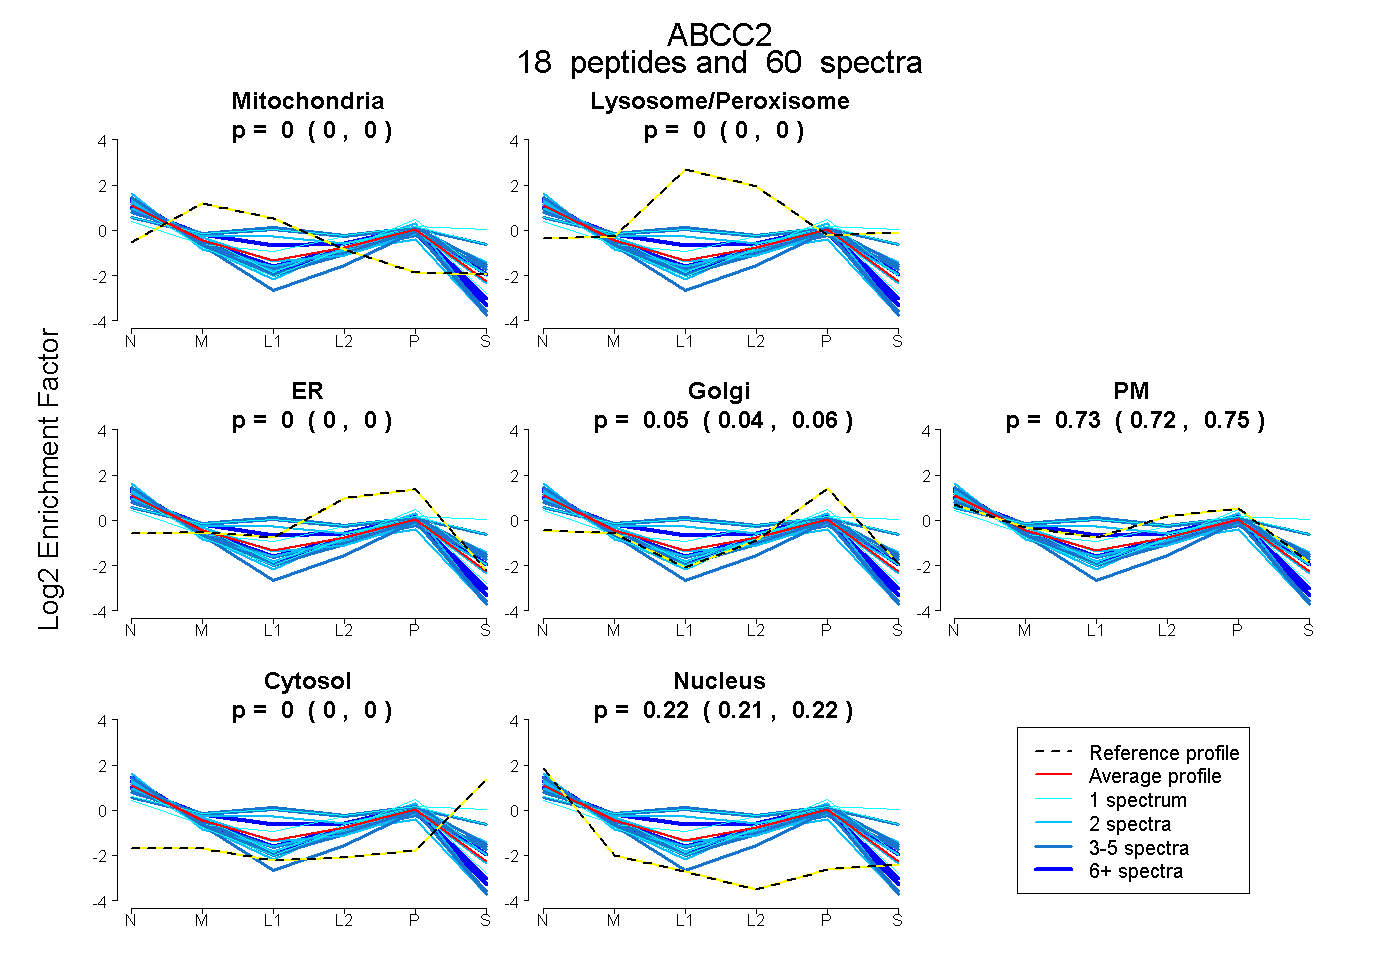
0.000 | 0.000
0.000 | 0.000
0.000 | 0.000
0.036 | 0.063
0.717 | 0.747
0.000 | 0.000
0.213 | 0.220
41peptides
spectra
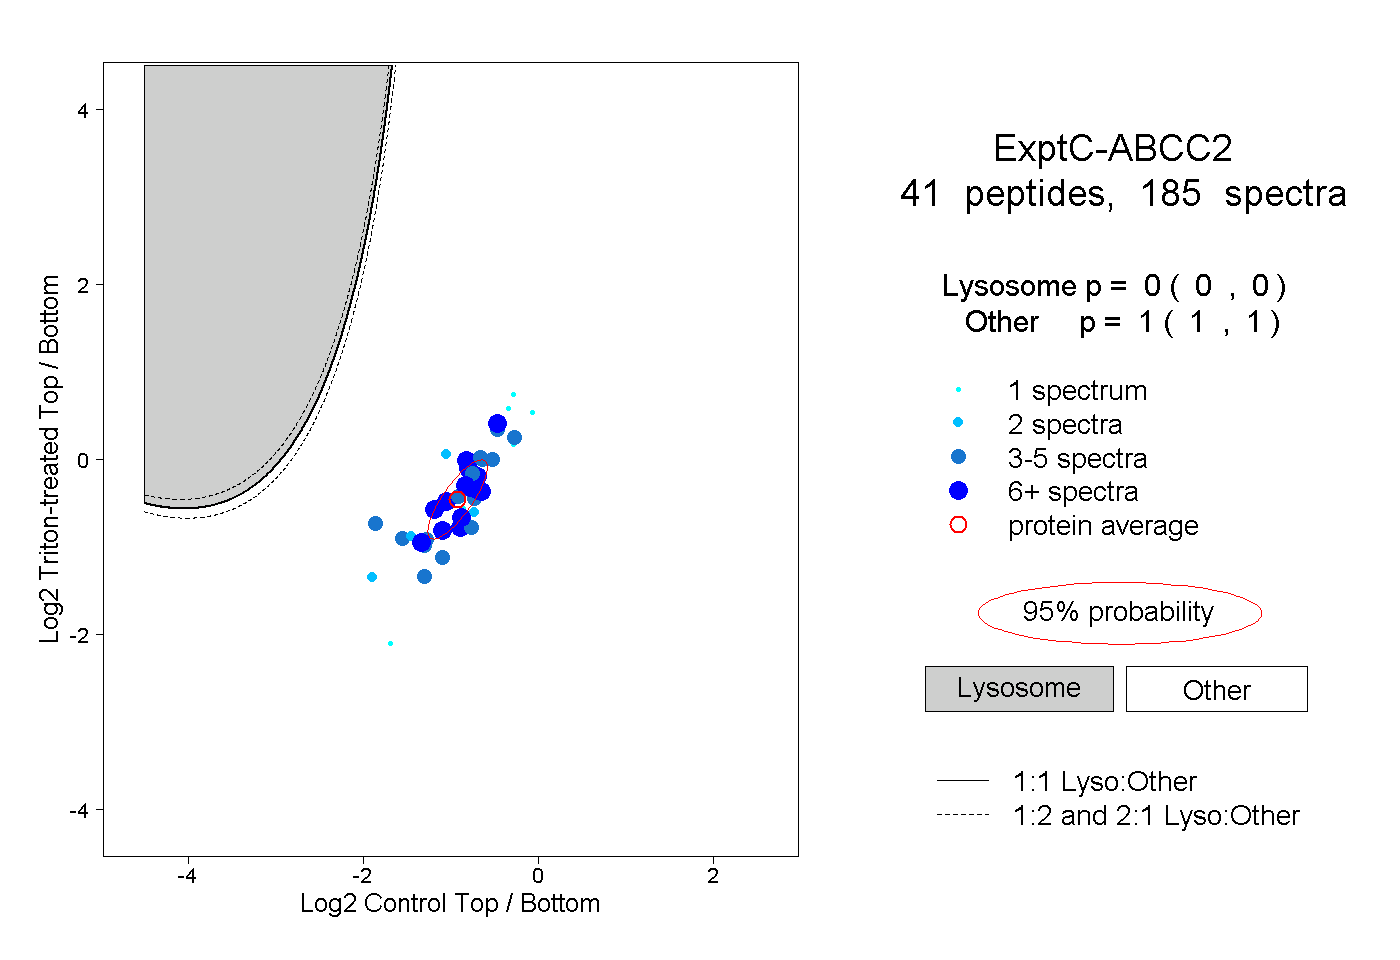
0.000 | 0.000
1.000 | 1.000
19peptides
spectra
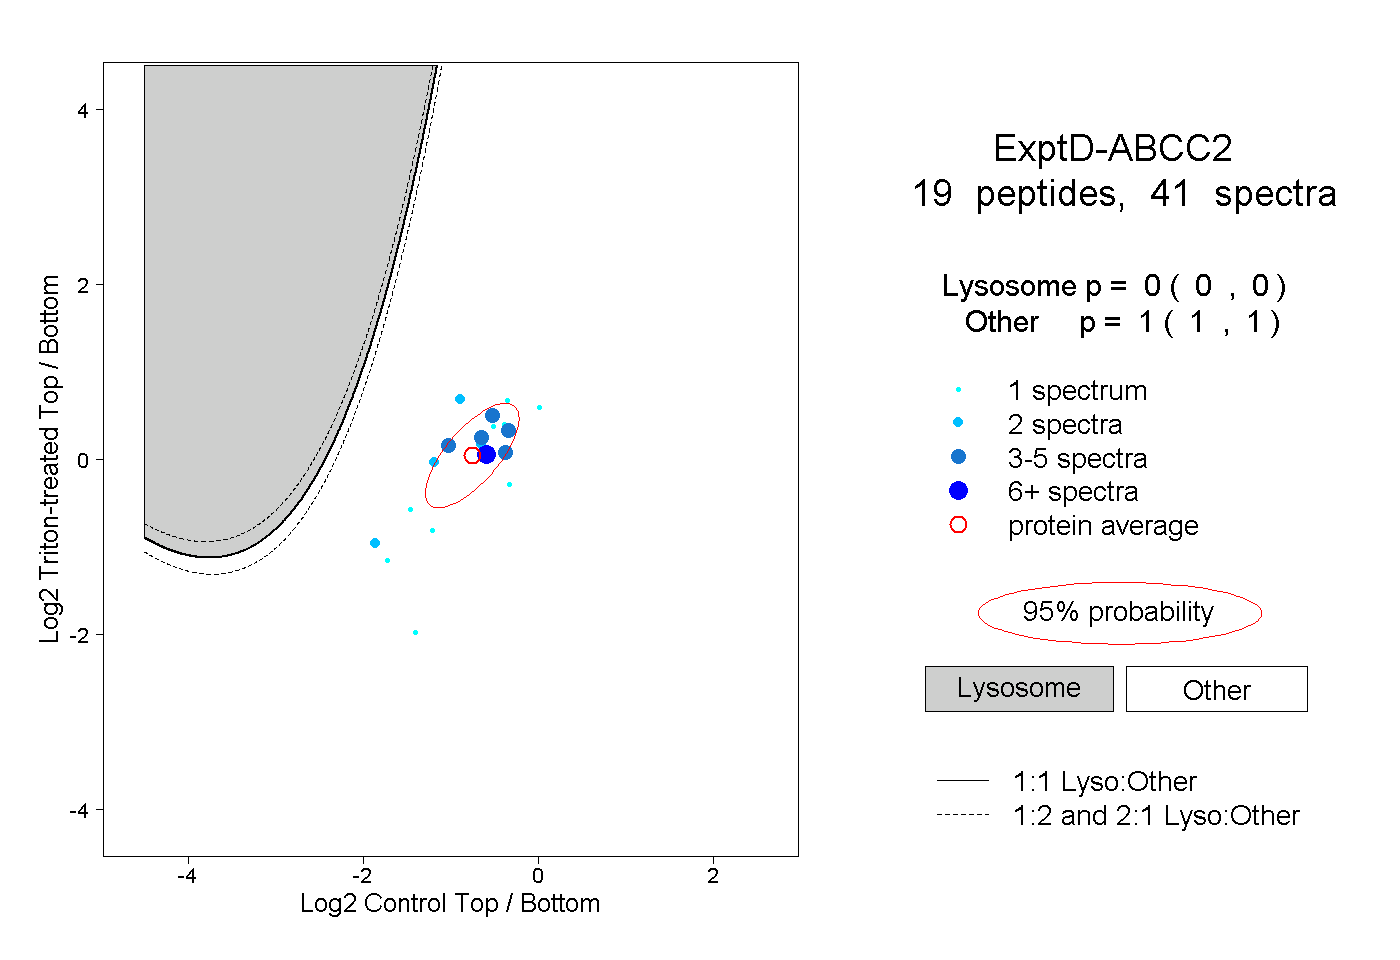
0.000 | 0.000
1.000 | 1.000