 18
18peptides
spectra
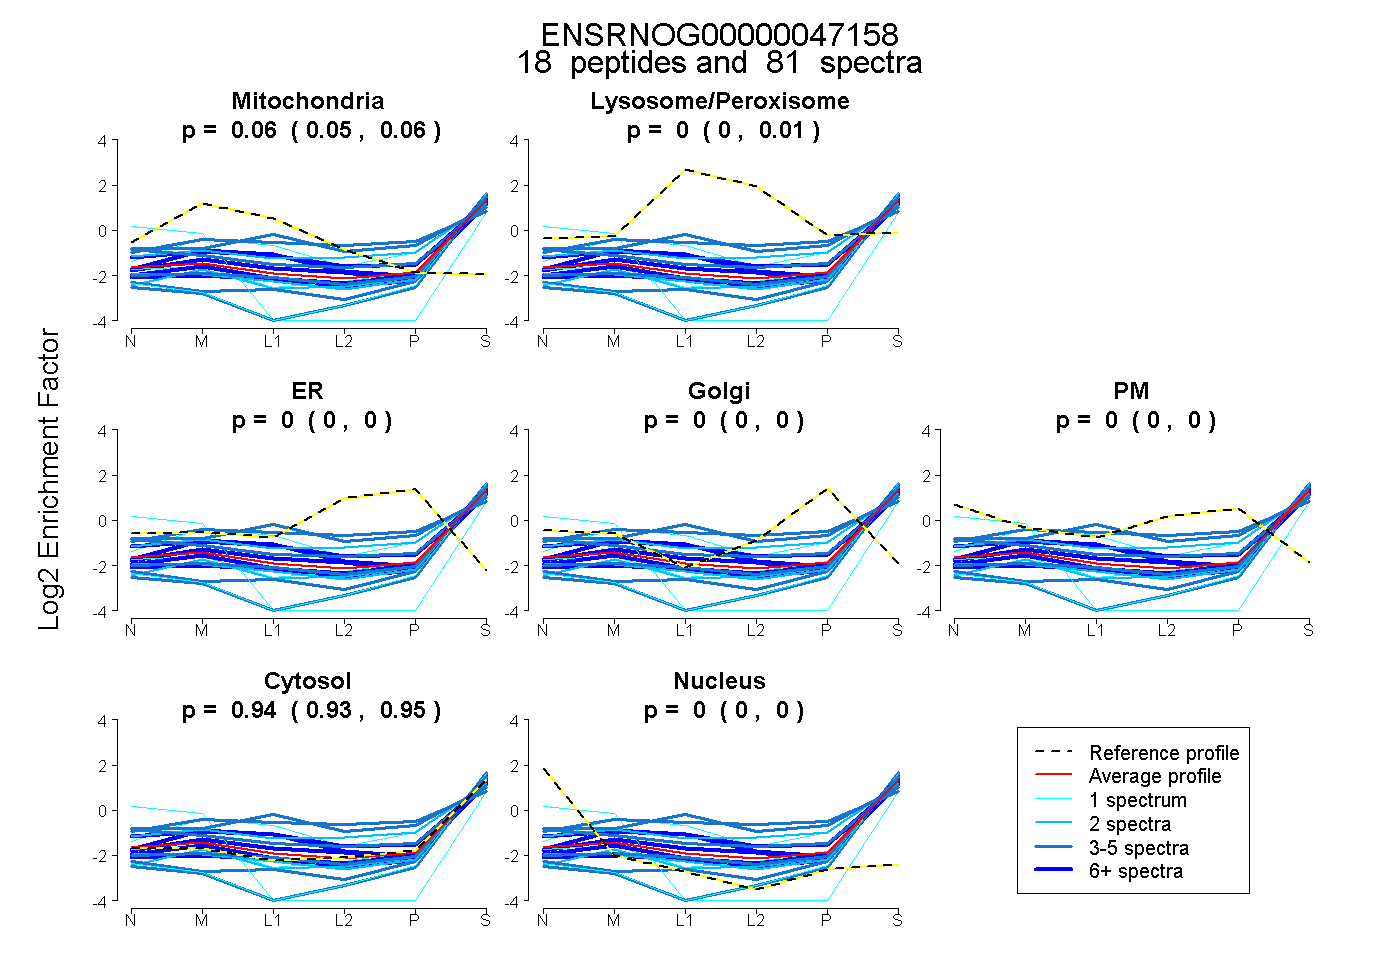
0.050 | 0.062
0.000 | 0.007
0.000 | 0.000
0.000 | 0.000
0.000 | 0.000
0.935 | 0.947
0.000 | 0.000
22peptides
spectra
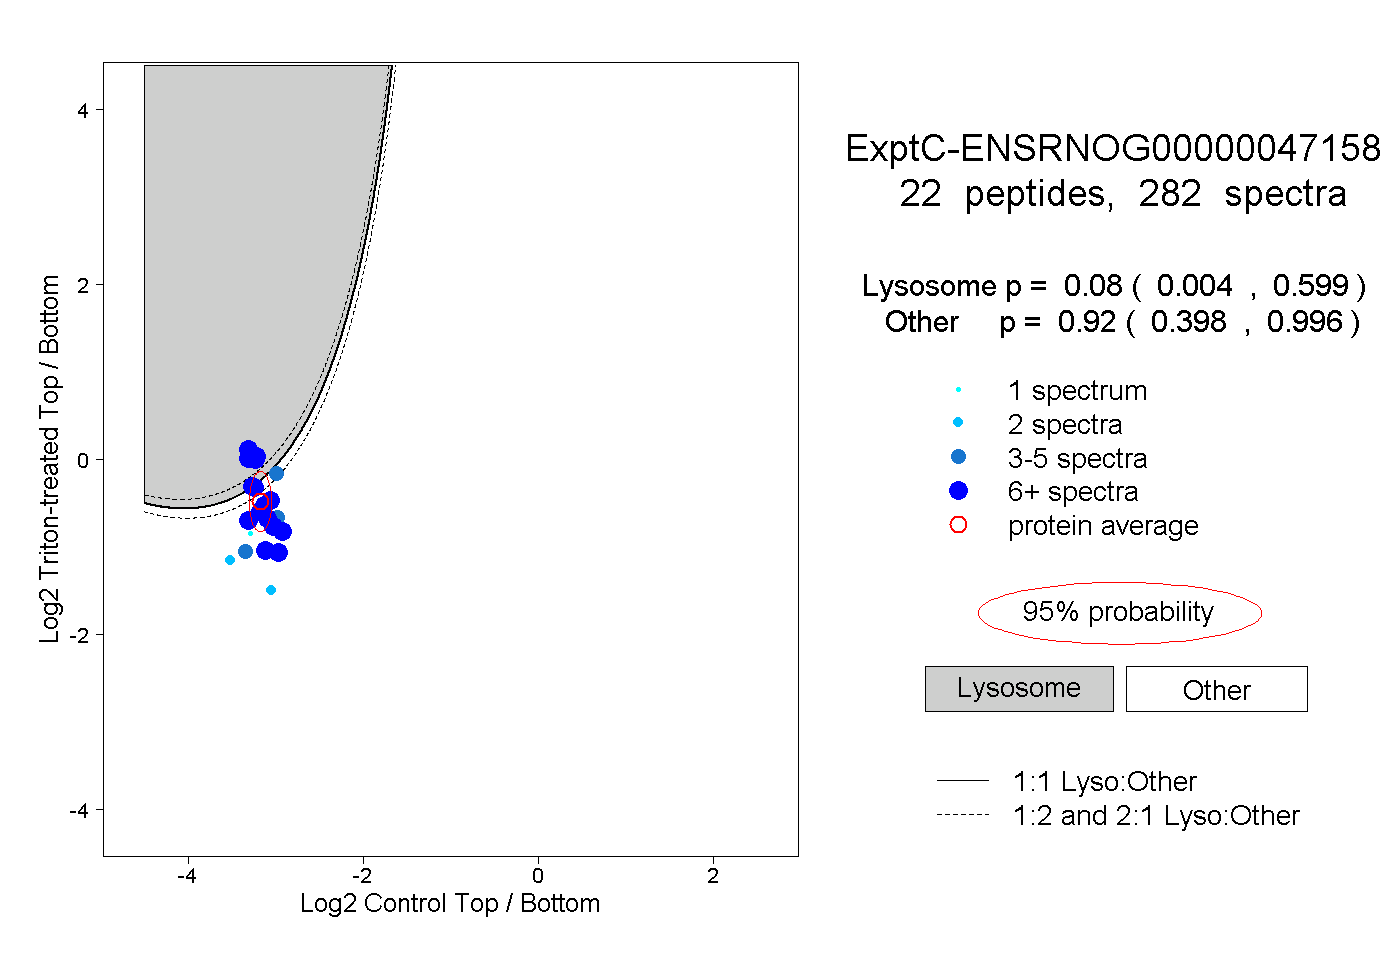
0.004 | 0.599
0.398 | 0.996
8peptides
spectra
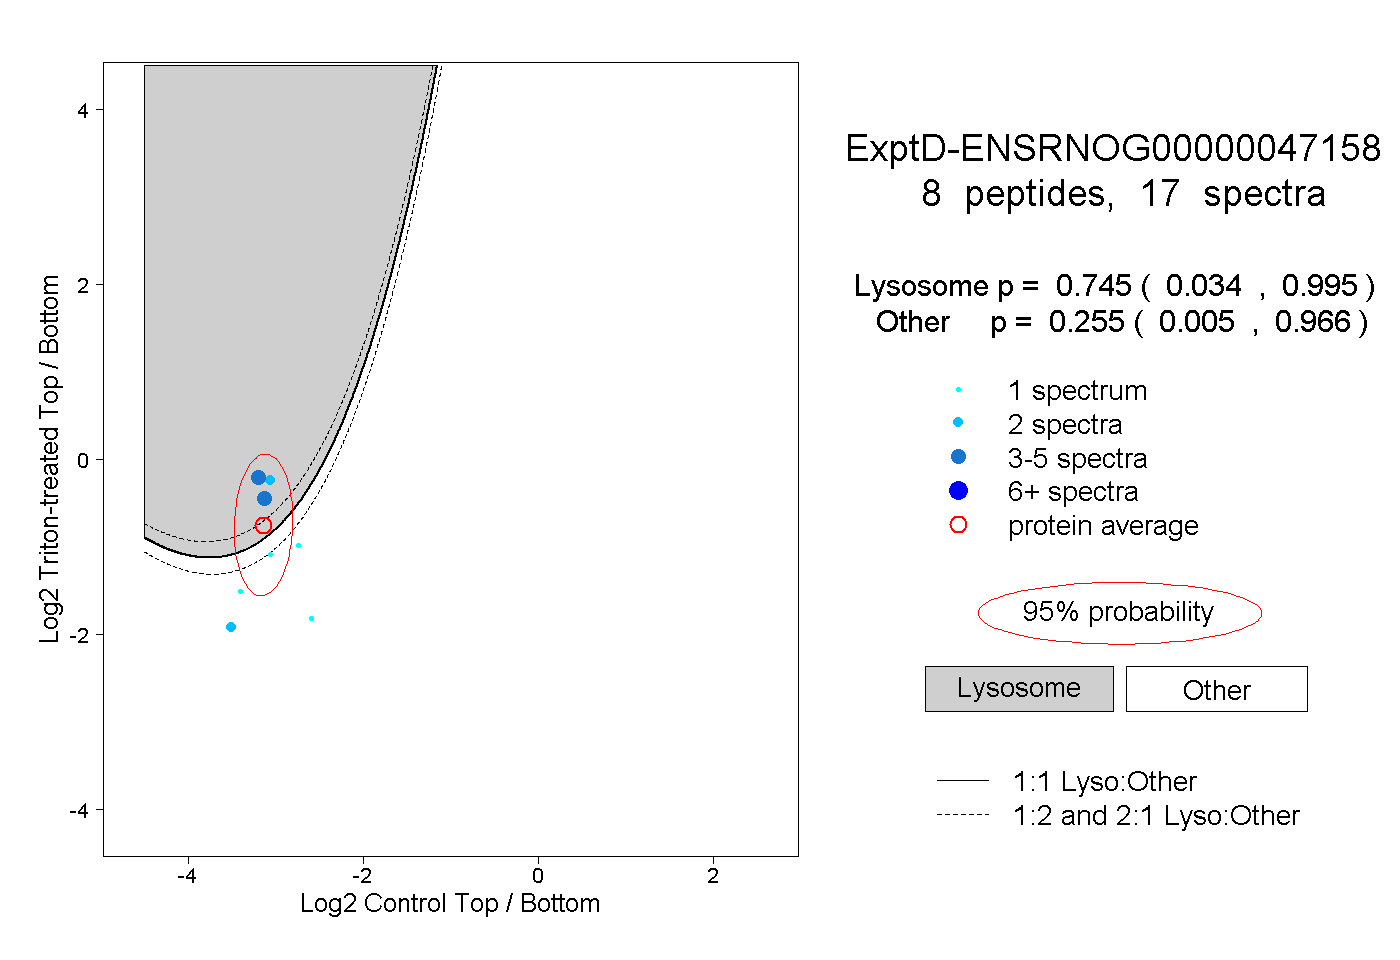
0.034 | 0.995
0.005 | 0.966