 18
18peptides
spectra
0.050 | 0.062
0.000 | 0.007
0.000 | 0.000
0.000 | 0.000
0.000 | 0.000
0.935 | 0.947
0.000 | 0.000
22peptides
spectra
0.004 | 0.599
0.398 | 0.996
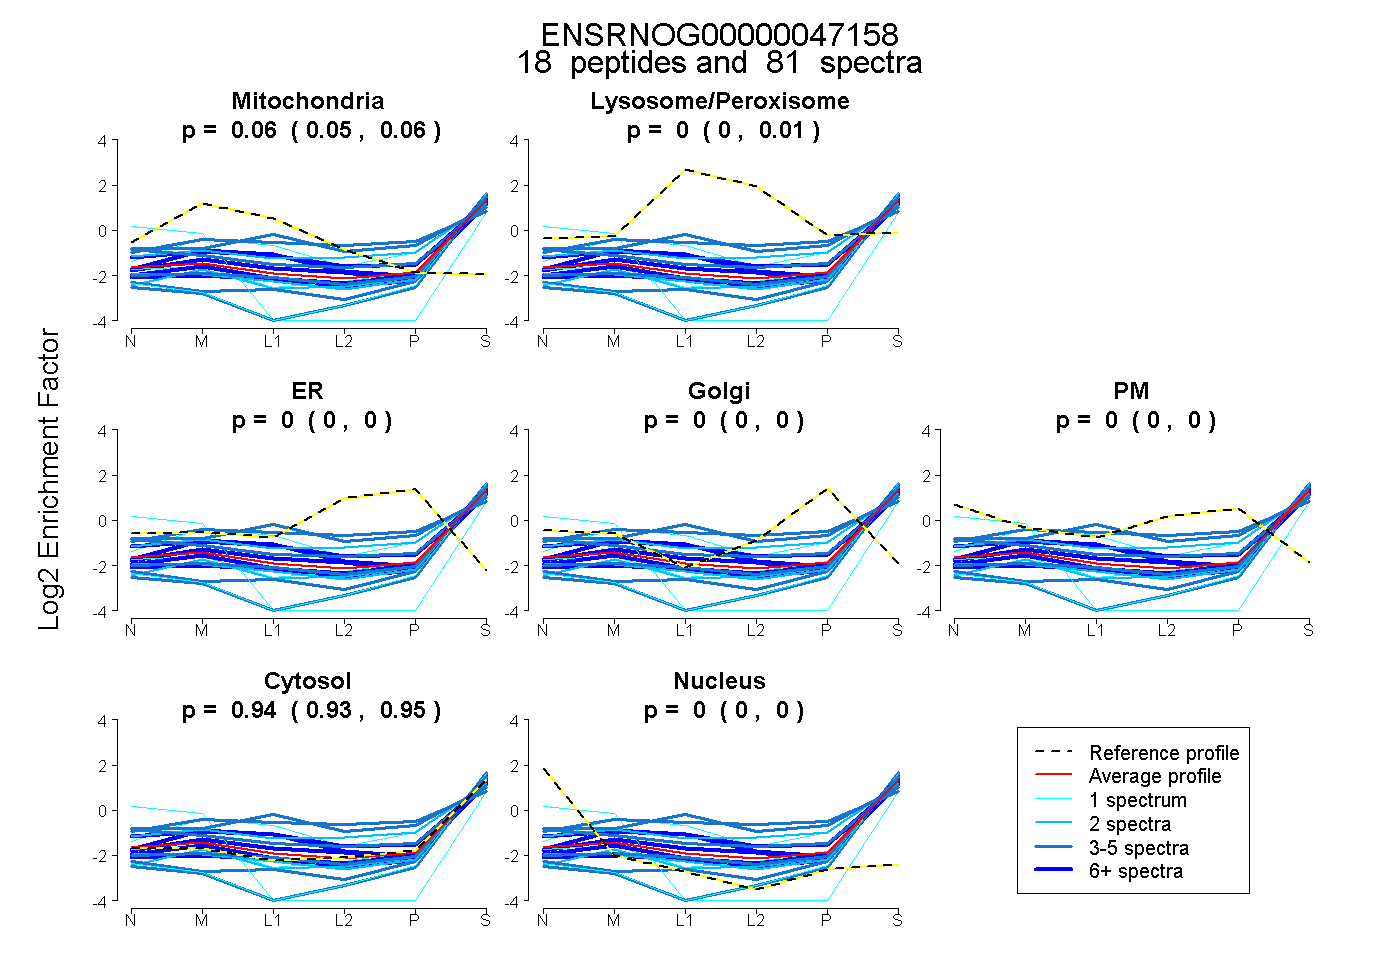
| Plot | Mito | Lyso or Perox | ER | Golgi | PM | Cytosol | Nucleus | ||||||
| Expt B |
18 peptides |
81 spectra |
|
0.058 0.050 | 0.062 |
0.000 0.000 | 0.007 |
0.000 0.000 | 0.000 |
0.000 0.000 | 0.000 |
0.000 0.000 | 0.000 |
0.942 0.935 | 0.947 |
0.000 0.000 | 0.000 |
|||
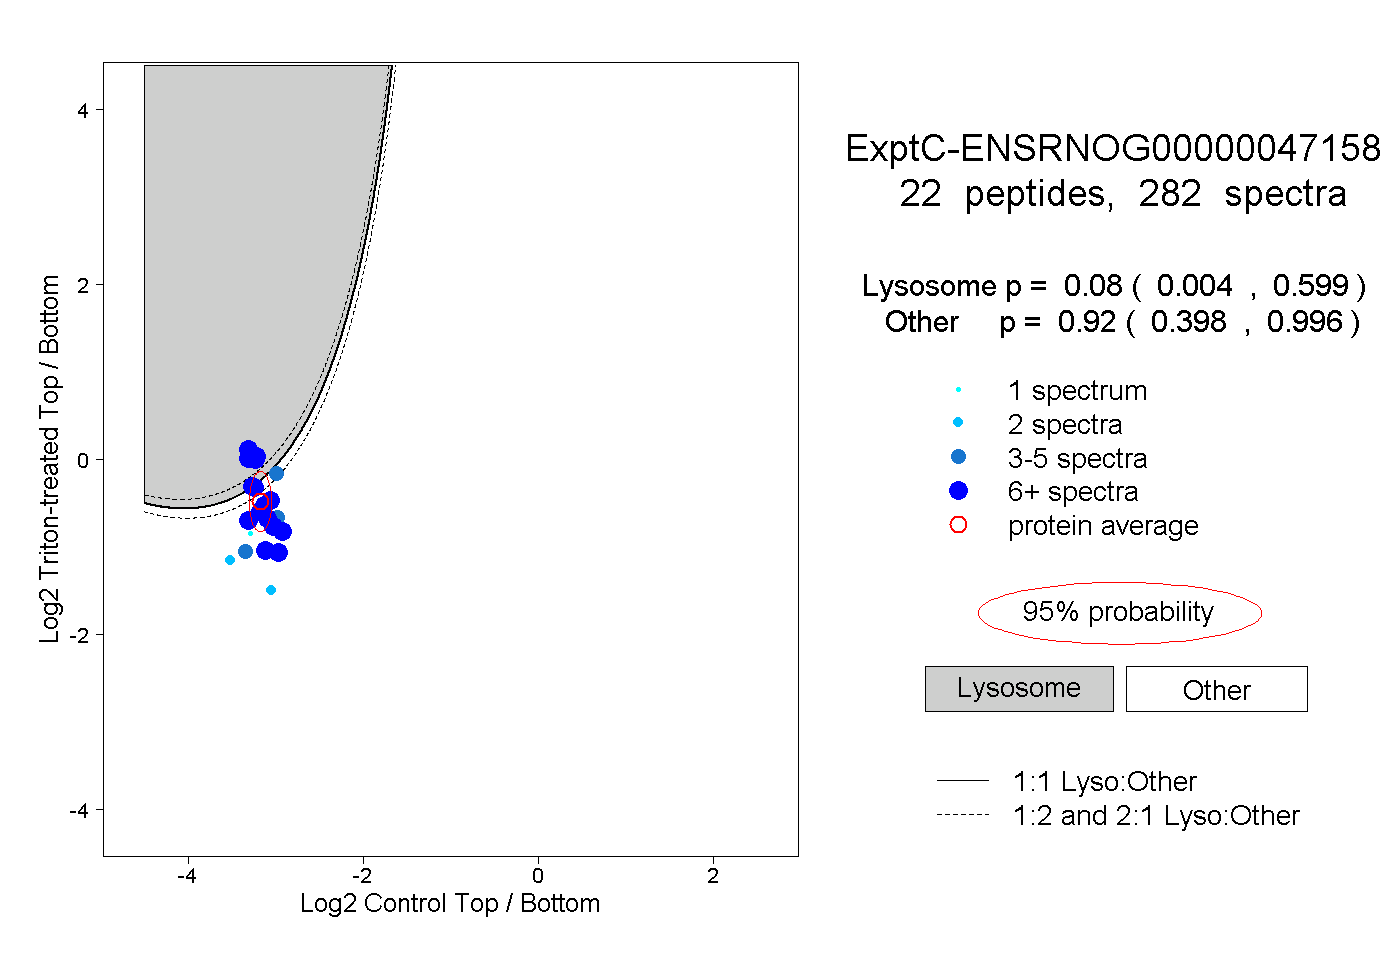
| Plot | Lyso | Other | |||||||||||
| Expt C |
22 peptides |
282 spectra |
|
0.080 0.004 | 0.599 |
0.920 0.398 | 0.996 |
| 14 spectra, VIQVPSK | 0.002 | 0.998 | ||||||||
| 10 spectra, GTWEKPGGEAPMGYDFWYQPR | 0.961 | 0.039 | ||||||||
| 27 spectra, IYVVDVGSEPR | 0.521 | 0.479 | ||||||||
| 11 spectra, QYDISNPK | 0.027 | 0.973 | ||||||||
| 6 spectra, LNPNFLVDFGK | 0.036 | 0.964 | ||||||||
| 14 spectra, HEIIQTLQMK | 0.023 | 0.977 | ||||||||
| 14 spectra, EEIVYLPCIYR | 0.000 | 1.000 | ||||||||
| 4 spectra, FLHDPDATQGFVGCALSSNIQR | 0.001 | 0.999 | ||||||||
| 12 spectra, LPMPHLK | 0.000 | 1.000 | ||||||||
| 16 spectra, EPLGPALAHELR | 0.000 | 1.000 | ||||||||
| 41 spectra, VIEPNEIHAK | 0.435 | 0.565 | ||||||||
| 4 spectra, EGSVMLQIDVDTANGGLK | 0.003 | 0.997 | ||||||||
| 32 spectra, DGLIPLEIR | 0.976 | 0.024 | ||||||||
| 2 spectra, CGPGYATPLEAMK | 0.000 | 1.000 | ||||||||
| 13 spectra, NEGGTWSVEK | 0.953 | 0.047 | ||||||||
| 27 spectra, LILPSIISSR | 0.007 | 0.993 | ||||||||
| 2 spectra, HNIMVSTEWAAPNVFK | 0.000 | 1.000 | ||||||||
| 15 spectra, QFYPNLIR | 0.041 | 0.959 | ||||||||
| 7 spectra, LTGQIFLGGSIVK | 0.000 | 1.000 | ||||||||
| 1 spectrum, LYVTTSLYSAWDK | 0.004 | 0.996 | ||||||||
| 3 spectra, VPGGPQMIQLSLDGK | 0.292 | 0.708 | ||||||||
| 7 spectra, GGFVLLDGETFEVK | 0.992 | 0.008 |
| Plot | Lyso | Other | |||||||||||
| Expt D |
8 peptides |
17 spectra |
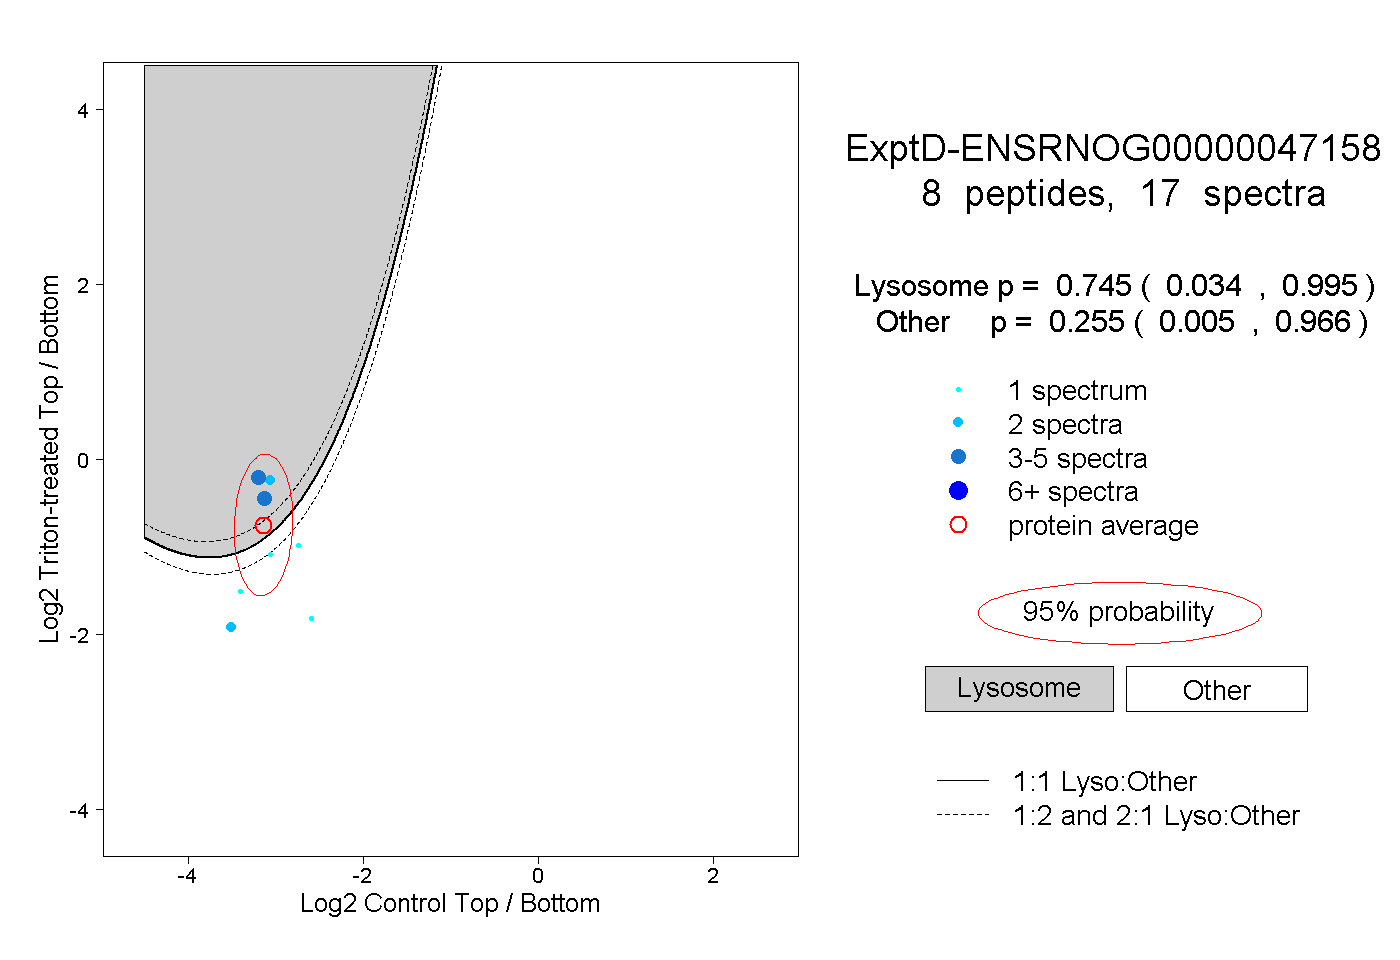 |
0.745 0.034 | 0.995 |
0.255 0.005 | 0.966 |