 5
5peptides
spectra
0.000 | 0.000
0.138 | 0.166
0.035 | 0.078
0.000 | 0.000
0.184 | 0.240
0.102 | 0.164
0.423 | 0.452
0.000 | 0.000
| Plot | Mito | Lyso | Perox | ER | Golgi | PM | Cytosol | Nucleus | |||||
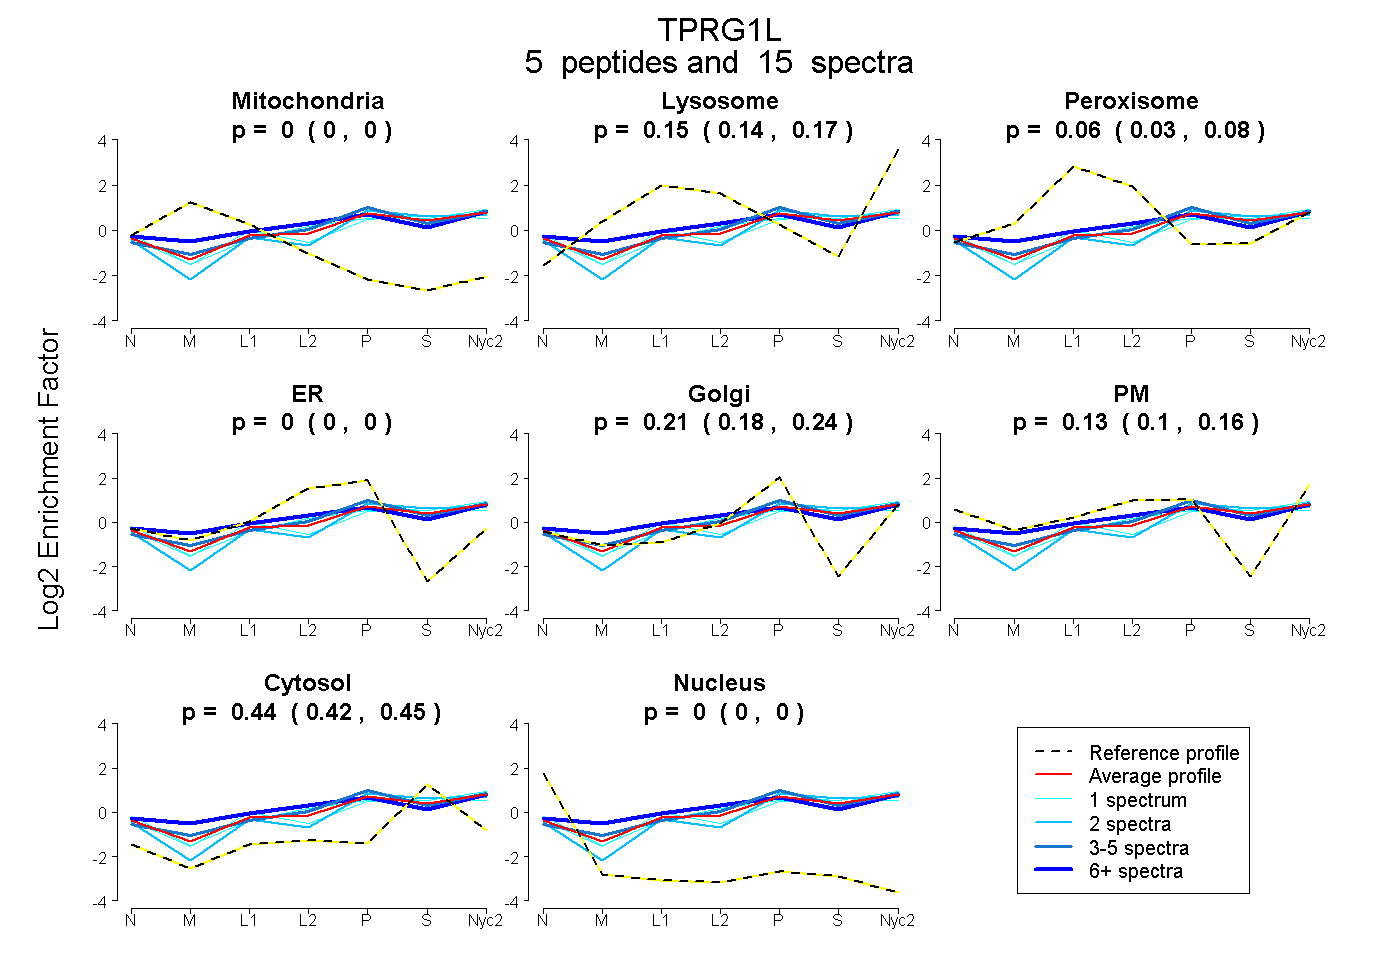
| Expt A |
5 peptides |
15 spectra |
|
0.000 0.000 | 0.000 |
0.154 0.138 | 0.166 |
0.059 0.035 | 0.078 |
0.000 0.000 | 0.000 |
0.214 0.184 | 0.240 |
0.134 0.102 | 0.164 |
0.439 0.423 | 0.452 |
0.000 0.000 | 0.000 |
| 2 spectra, QGAGTPLR | 0.000 | 0.145 | 0.000 | 0.000 | 0.333 | 0.000 | 0.522 | 0.000 | ||
| 3 spectra, QTLWPLNVHDPTR | 0.000 | 0.200 | 0.056 | 0.000 | 0.367 | 0.000 | 0.377 | 0.000 | ||
| 1 spectrum, EYFVFRPGTIEQAVEEIR | 0.000 | 0.137 | 0.000 | 0.000 | 0.004 | 0.366 | 0.493 | 0.000 | ||
| 8 spectra, QSRPSFINR | 0.000 | 0.113 | 0.181 | 0.000 | 0.201 | 0.181 | 0.323 | 0.000 | ||
| 1 spectrum, EGFGVR | 0.000 | 0.089 | 0.129 | 0.000 | 0.200 | 0.079 | 0.503 | 0.000 |
| Plot | Mito | Lyso or Perox | ER | Golgi | PM | Cytosol | Nucleus | ||||||
| Expt B |
1 peptide |
1 spectrum |
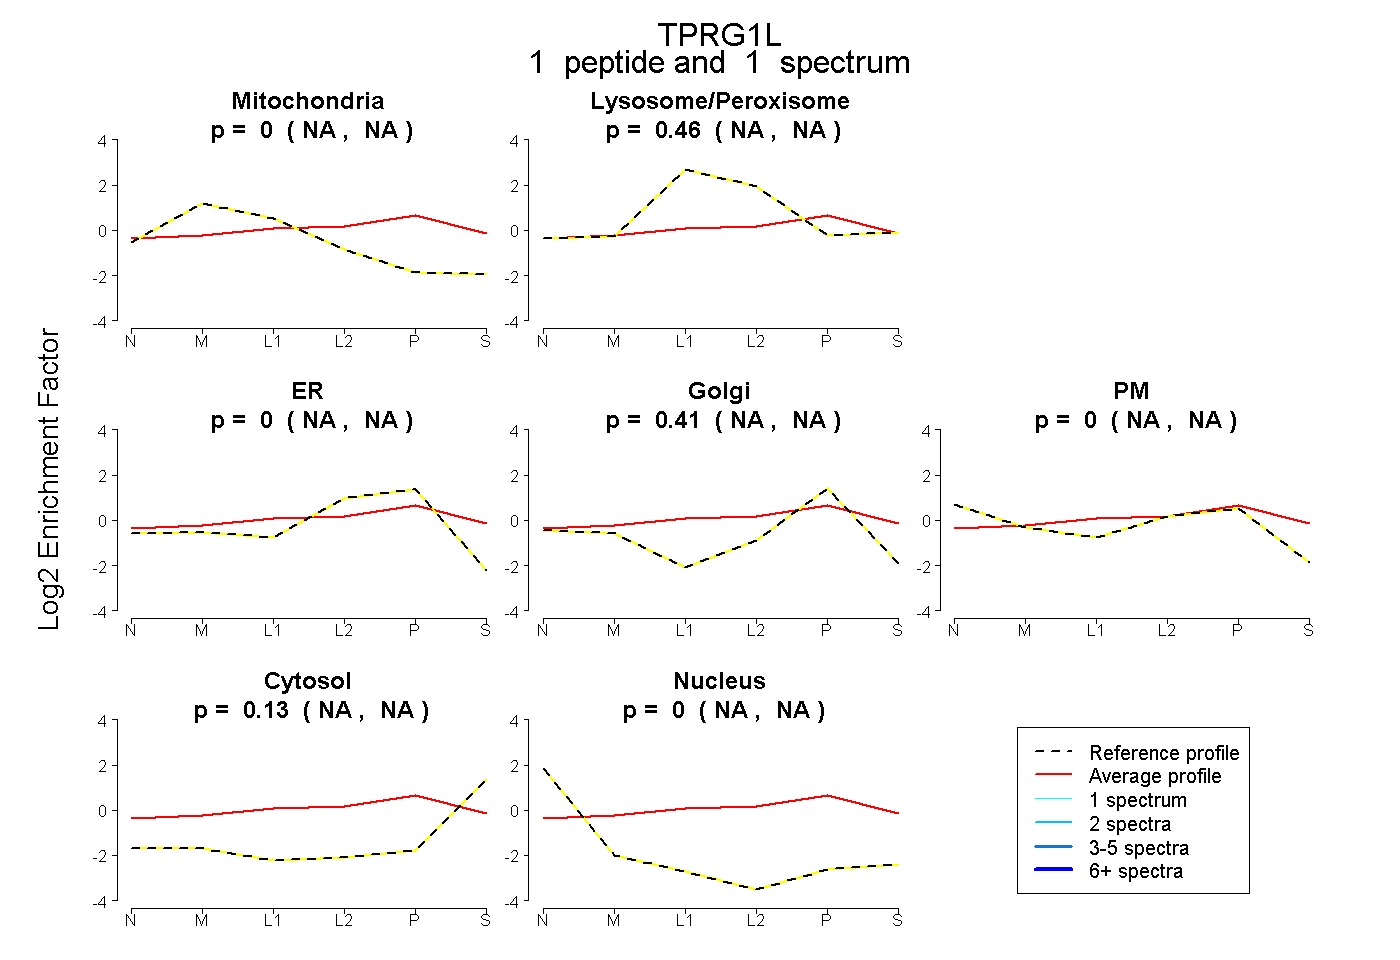 |
0.000 NA | NA |
0.465 NA | NA |
0.000 NA | NA |
0.410 NA | NA |
0.000 NA | NA |
0.125 NA | NA |
0.000 NA | NA |
|||
| Plot | Lyso | Other | |||||||||||
| Expt C |
4 peptides |
12 spectra |
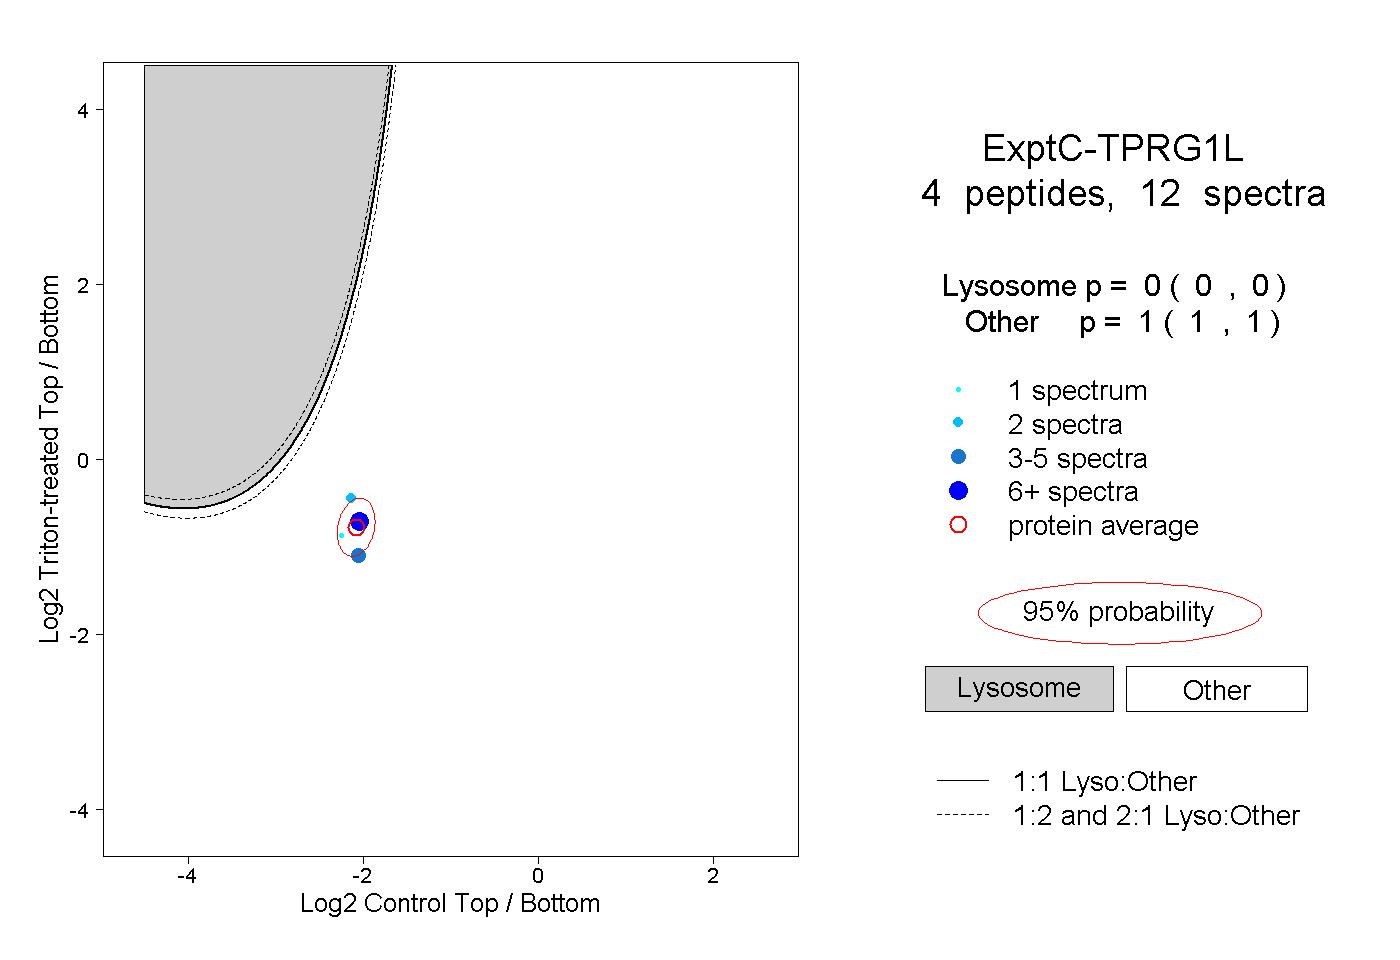 |
0.000 0.000 | 0.000 |
1.000 1.000 | 1.000 |